QUESTION IMAGE
Question
the weights of the largemouth bass in one location are skewed right with a mean of 5.13 pounds and a standard deviation of 4.07 pounds.
create a sampling distribution for the mean weight of a sample of size \\(n = 43\\) of largemouth bass in this location.
(a) the mean of the sampling distribution is and the standard deviation is
round to 2 decimal places.
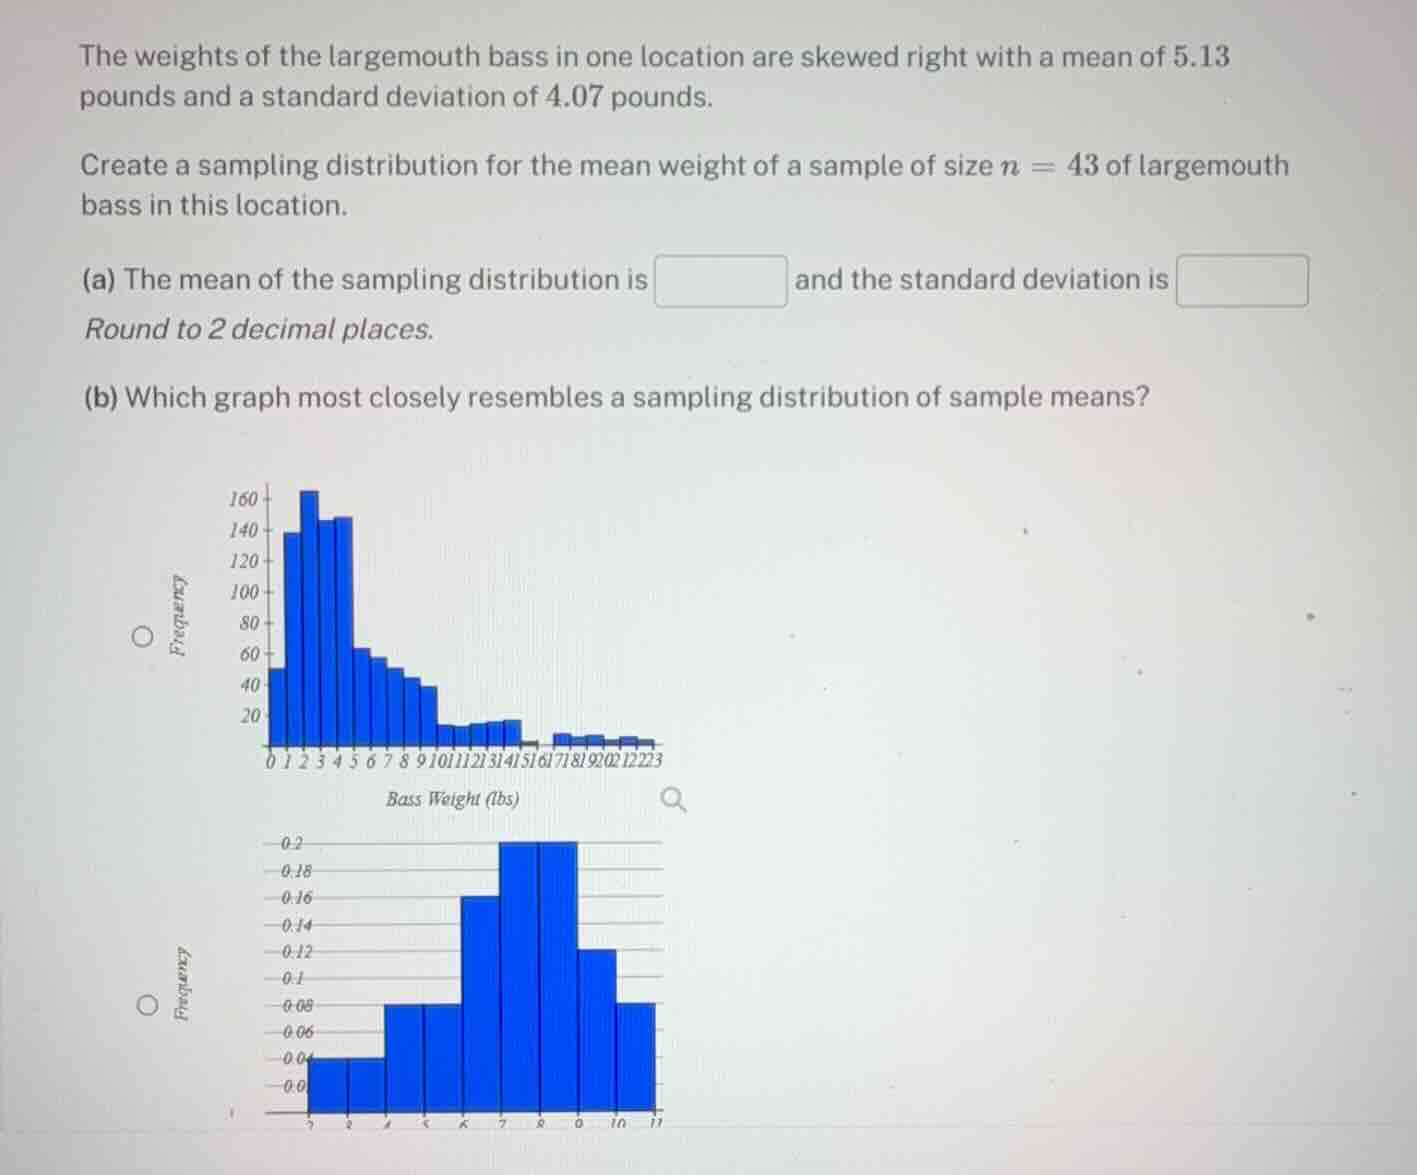
(b) which graph most closely resembles a sampling distribution of sample means?
Calculate the mean of the sampling distribution
Using the Sampling Distribution of the Mean knowledge point
Calculate the standard deviation of the sampling distribution
Using the Standard Error of the Mean knowledge point
Determine the shape of the sampling distribution
Using the Central Limit Theorem knowledge point
Since the sample size \(n = 43\) is sufficiently large (\(n \ge 30\)), the sampling distribution of the sample mean \(\bar{x}\) is approximately normally distributed (symmetric and bell-shaped), centered at \(\mu_{\bar{x}} = 5.13\). The first graph shows a highly right-skewed distribution of individual weights, whereas the second graph is symmetric, bell-shaped, and centered near 5. Thus, the second graph represents the sampling distribution.

Snap & solve any problem in the app
Get step-by-step solutions on Sovi AI
Photo-based solutions with guided steps
Explore more problems and detailed explanations
Question a
The mean of the sampling distribution is <blank>5.13</blank> and the standard deviation is <blank>0.62</blank>
Question b
- (A) The first graph (skewed right, representing the population or a single sample)
- (B) The second graph (symmetric and bell-shaped, representing the sampling distribution of the mean) (Correct answer)