QUESTION IMAGE
Question
u2:04: unit 2 test
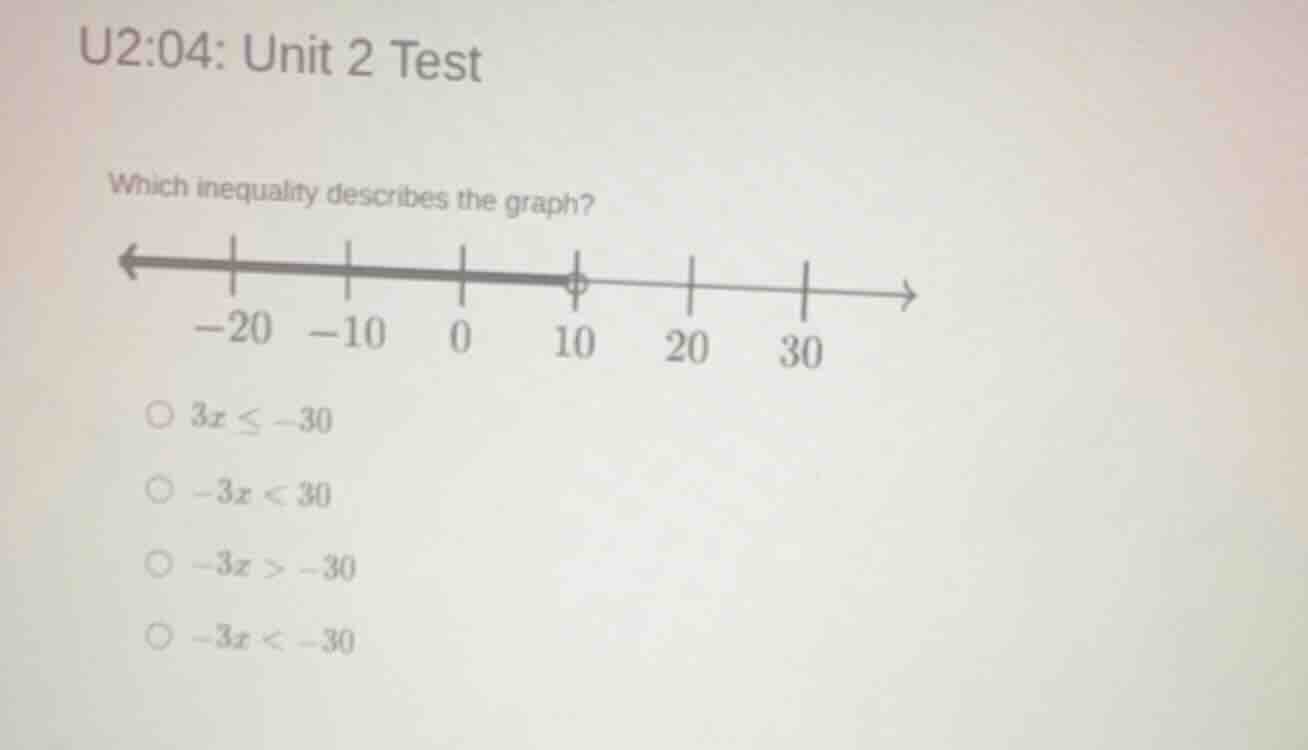
which inequality describes the graph?
-20 -10 0 10 20 30
○ $3x \leq -30$
○ $-3x < 30$
○ $-3x > -30$
○ $-3x < -30$
Step1: Analyze the graph
The graph has an open circle at 10 and the arrow points to the left, so the inequality represents \(x < 10\) (open circle means not including 10, arrow left means less than).
Step2: Solve each option
- Option 1: \(3x \leq - 30\), divide both sides by 3: \(x \leq - 10\). Doesn't match.
- Option 2: \(-3x < 30\), divide both sides by - 3 (reverse inequality): \(x > - 10\). Doesn't match.
- Option 3: \(-3x > - 30\), divide both sides by - 3 (reverse inequality): \(x < 10\). Matches the graph.
- Option 4: \(-3x < - 30\), divide both sides by - 3 (reverse inequality): \(x > 10\). Doesn't match.

Snap & solve any problem in the app
Get step-by-step solutions on Sovi AI
Photo-based solutions with guided steps
Explore more problems and detailed explanations
\(-3x > - 30\) (the third option)