QUESTION IMAGE
Question
type the correct answer in each box.
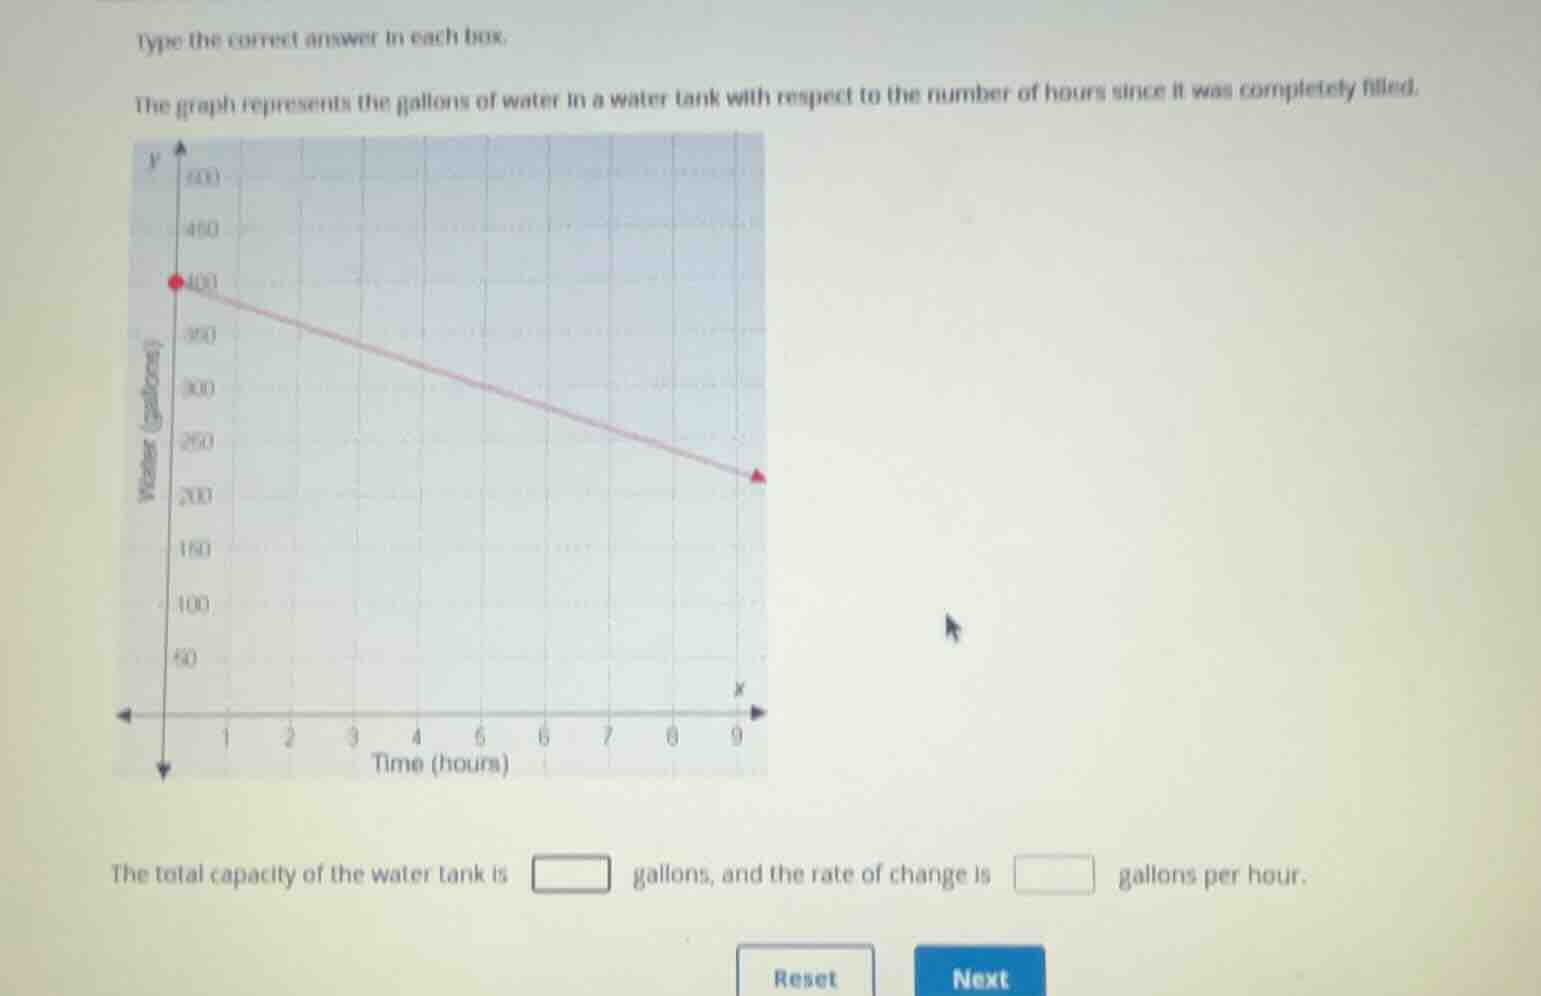
the graph represents the gallons of water in a water tank with respect to the number of hours since it was completely filled.
the total capacity of the water tank is gallons, and the rate of change is gallons per hour.
Identify the initial capacity
Using the Linear Function Interpretation knowledge point
The y-intercept represents the initial amount of water when the tank was completely filled at \(t = 0\).
Looking at the graph, the line starts on the y-axis at the point \((0, 400)\).
Thus, the total capacity of the water tank is \(400\) gallons.
Calculate the rate of change
Using the Slope of a Line knowledge point
The rate of change is \(-20\) gallons per hour.

Snap & solve any problem in the app
Get step-by-step solutions on Sovi AI
Photo-based solutions with guided steps
Explore more problems and detailed explanations
The total capacity of the water tank is <blank>400</blank> gallons, and the rate of change is <blank>-20</blank> gallons per hour.