QUESTION IMAGE
Question
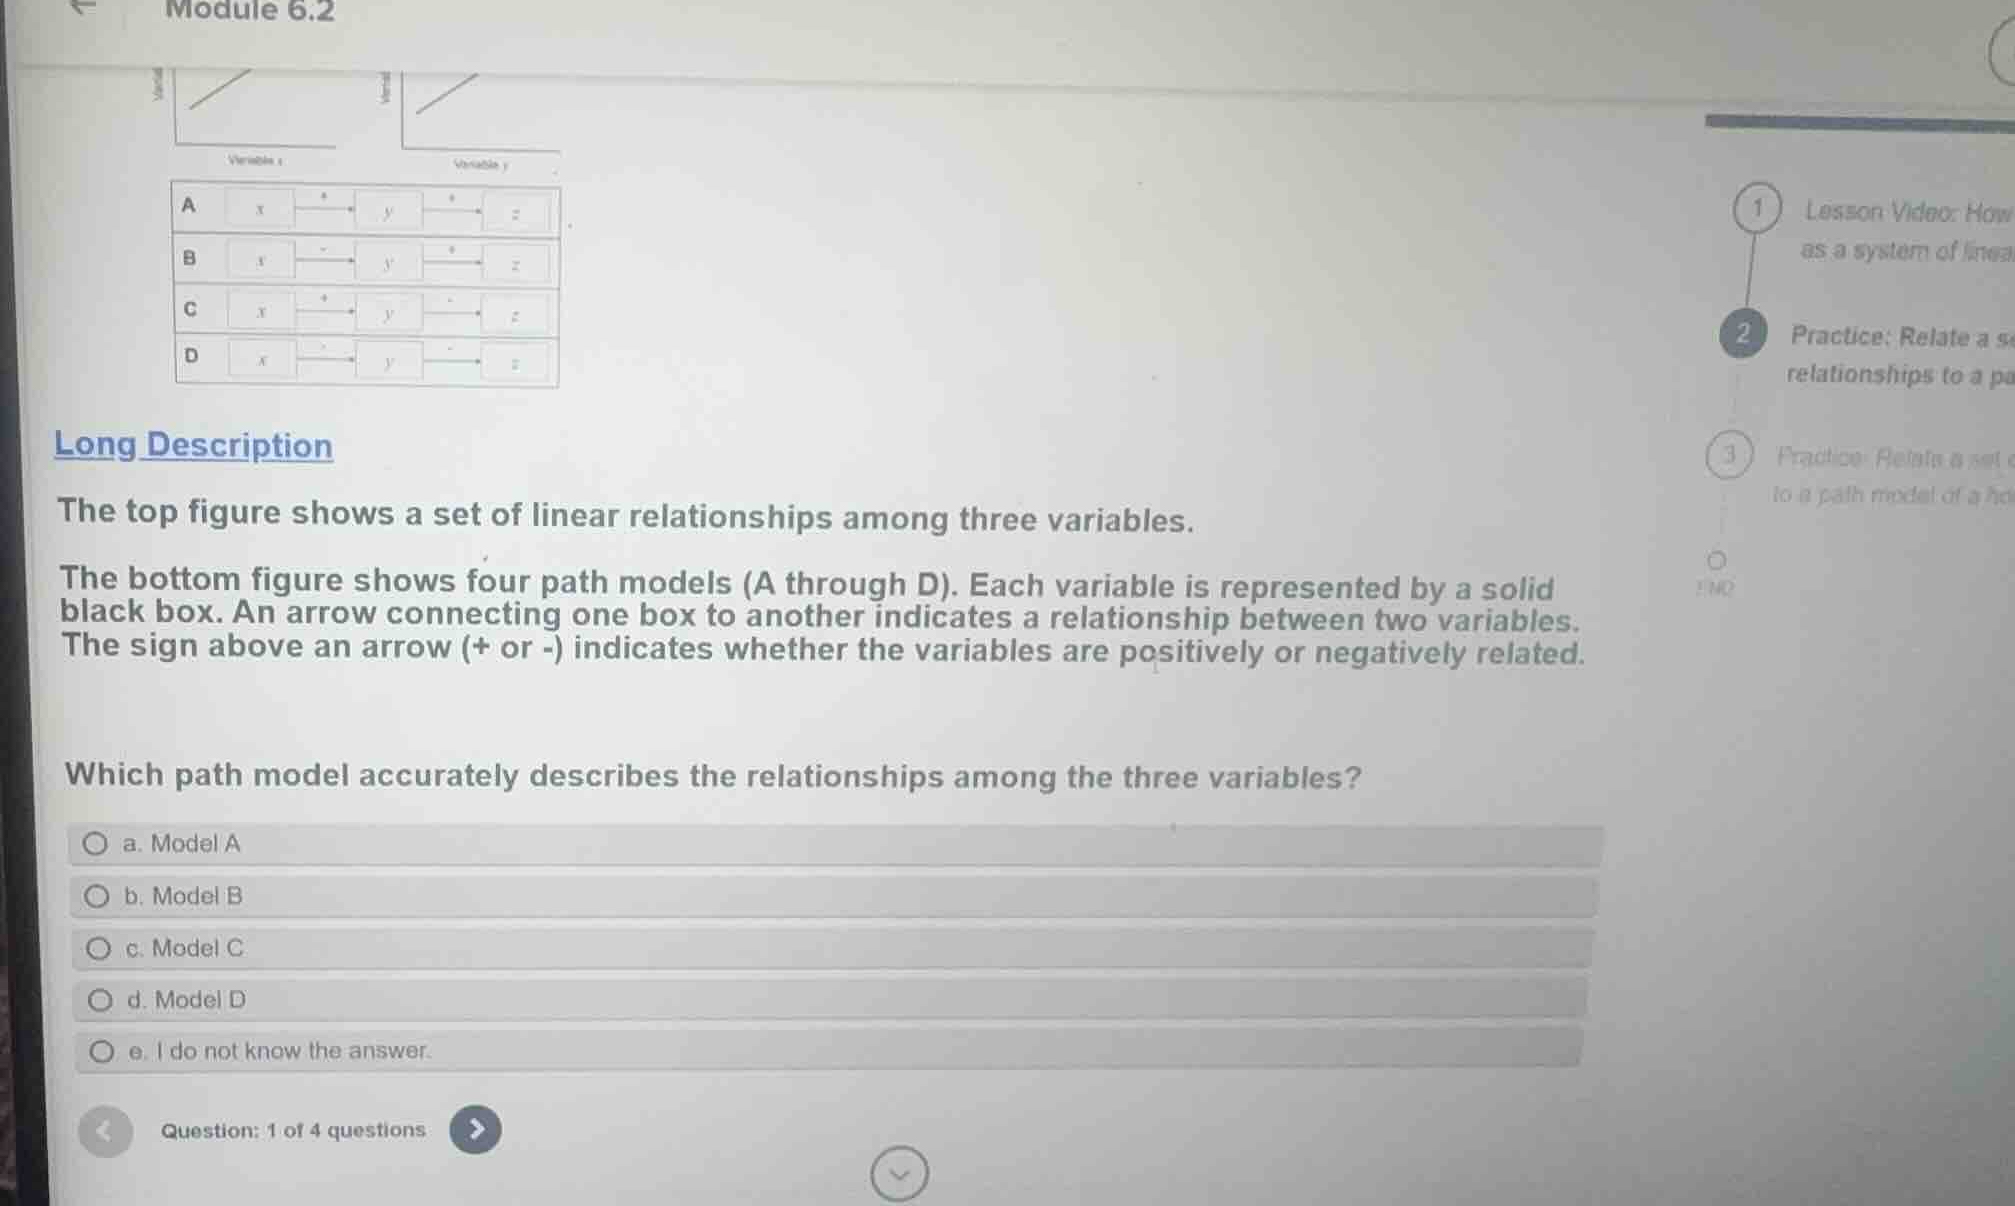
the top figure shows a set of linear relationships among three variables.
the bottom figure shows four path models (a through d). each variable is represented by a solid black box. an arrow connecting one box to another indicates a relationship between two variables. the sign above an arrow (+ or -) indicates whether the variables are positively or negatively related.
which path model accurately describes the relationships among the three variables?
a. model a
b. model b
c. model c
d. model d
e. i do not know the answer.
Analyze the top figure relationships
The top figure shows two plots representing linear relationships:
- The first plot has \(x\) on the horizontal axis and \(y\) on the vertical axis, showing a line with a positive slope. This indicates a positive relationship between \(x\) and \(y\) (\(x \xrightarrow{+} y\)).
- The second plot has \(y\) on the horizontal axis and \(z\) on the vertical axis, showing a line with a positive slope. This indicates a positive relationship between \(y\) and \(z\) (\(y \xrightarrow{+} z\)).
Evaluate the path models
Let's examine the four path models (A through D) shown in the bottom figure:
- Model A: Shows \(x \xrightarrow{+} y\) and \(y \xrightarrow{+} z\).
- Model B: Shows \(x \xrightarrow{-} y\) and \(y \xrightarrow{+} z\).
- Model C: Shows \(x \xrightarrow{+} y\) and \(y \xrightarrow{-} z\).
- Model D: Shows \(x \xrightarrow{-} y\) and \(y \xrightarrow{-} z\).
Match the correct model
Since both relationships (\(x\) to \(y\) and \(y\) to \(z\)) are positive, the correct path model must have positive signs (\(+\)) above both arrows. This corresponds exactly to Model A.

Snap & solve any problem in the app
Get step-by-step solutions on Sovi AI
Photo-based solutions with guided steps
Explore more problems and detailed explanations
- a. Model A (Correct answer)
- b. Model B
- c. Model C
- d. Model D
- e. I do not know the answer.