QUESTION IMAGE
Question
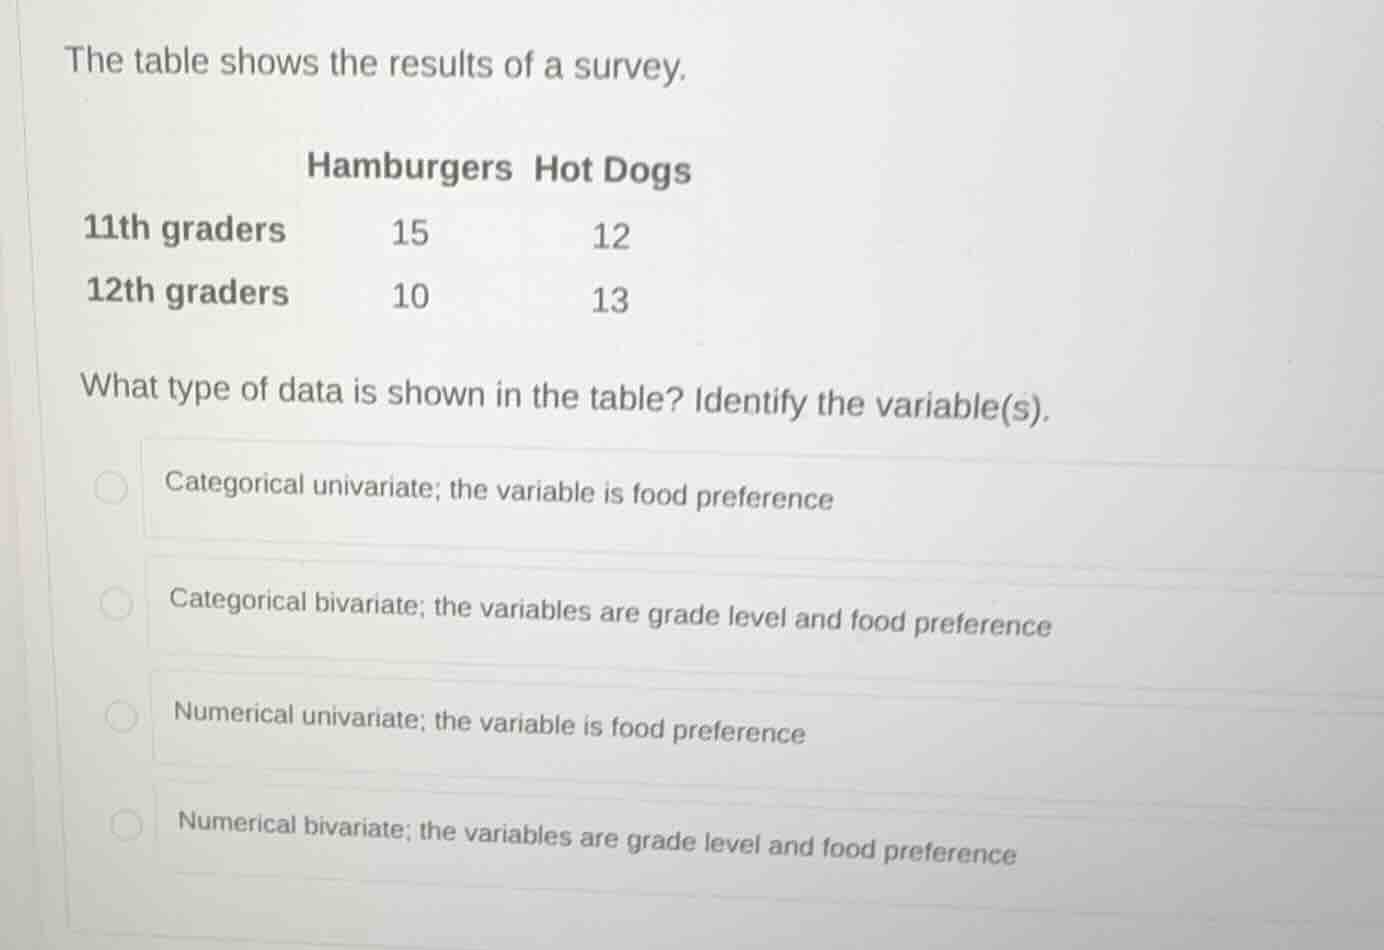
the table shows the results of a survey.
$$\
LATEXBLOCK0
$$
what type of data is shown in the table? identify the variable(s).
- categorical univariate; the variable is food preference
- categorical bivariate; the variables are grade level and food preference
- numerical univariate; the variable is food preference
- numerical bivariate; the variables are grade level and food preference
Identify the data type
Using the Categorical Data and Bivariate Data knowledge points
- The data records two distinct qualitative characteristics for each survey respondent: their grade level (11th or 12th grade) and their food preference (Hamburgers or Hot Dogs).
- Since both characteristics describe qualitative categories rather than numerical measurements, the data is categorical.
- Because two variables are measured simultaneously for each individual to study their relationship, the data is bivariate.
Identify the variables
Using the Statistical Variables knowledge point
- The two variables being recorded and compared in this two-way table are:
- Grade level (with categories: 11th graders, 12th graders)
- Food preference (with categories: Hamburgers, Hot Dogs)
- Therefore, the correct option is the one identifying the data as categorical bivariate with variables grade level and food preference.

Snap & solve any problem in the app
Get step-by-step solutions on Sovi AI
Photo-based solutions with guided steps
Explore more problems and detailed explanations
- (A) Categorical univariate; the variable is food preference
- (B) Categorical bivariate; the variables are grade level and food preference (Correct answer)
- (C) Numerical univariate; the variable is food preference
- (D) Numerical bivariate; the variables are grade level and food preference