QUESTION IMAGE
Question
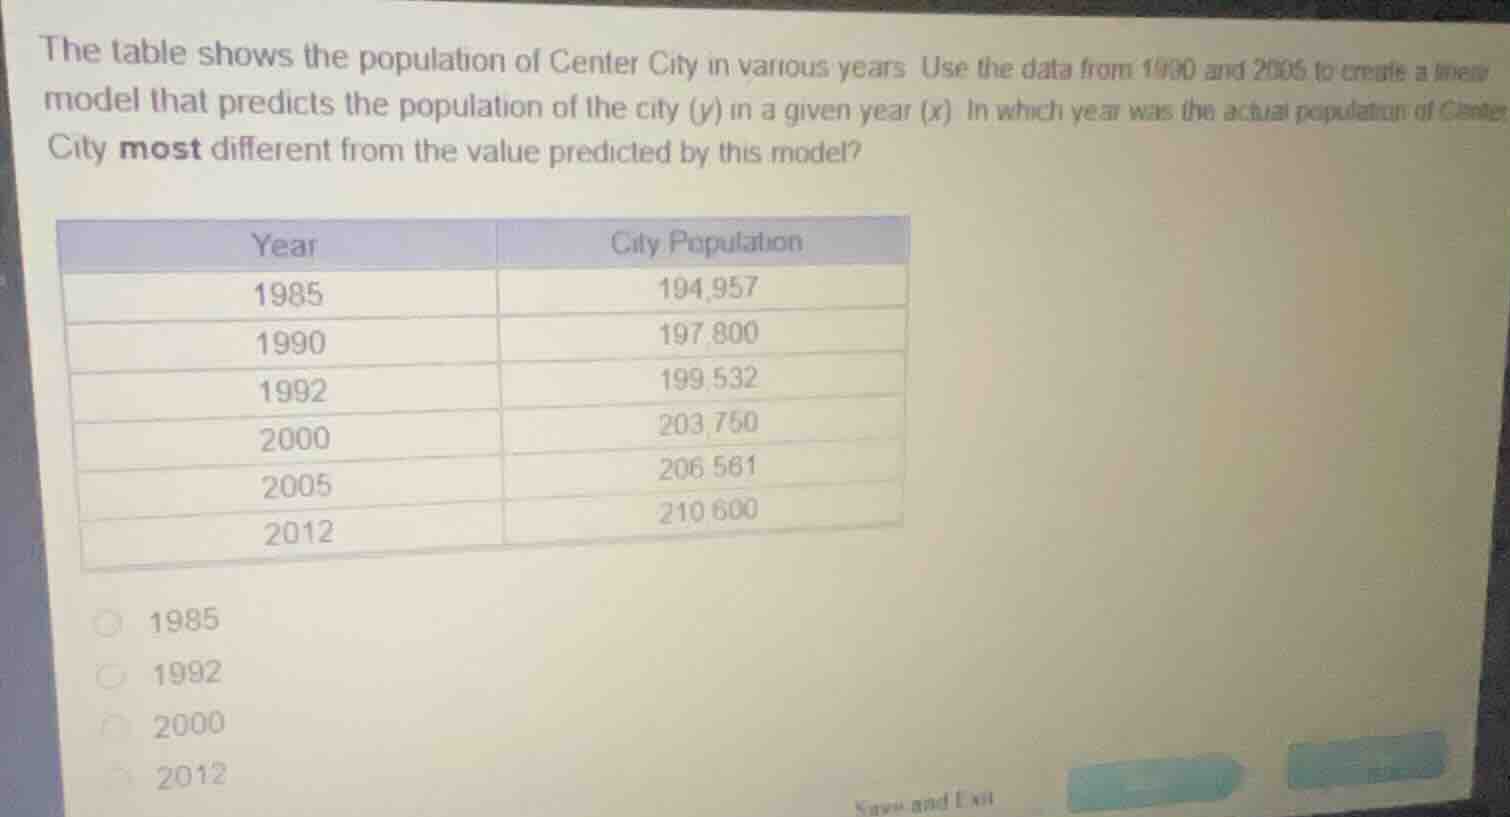
the table shows the population of center city in various years. use the data from 1990 and 2005 to create a linear model that predicts the population of the city (y) in a given year (x). in which year was the actual population of center city most different from the value predicted by this model?
\
$$\begin{tabular}{|c|c|}
\\hline
year & city population \\\\
\\hline
1985 & 194,957 \\\\
\\hline
1990 & 197,800 \\\\
\\hline
1992 & 199,532 \\\\
\\hline
2000 & 203,750 \\\\
\\hline
2005 & 206,561 \\\\
\\hline
2012 & 210,600 \\\\
\\hline
\\end{tabular}$$
- 1985
- 1992
- 2000
- 2012
Find the linear model using 1990 and 2005 data
$$
LATEXBLOCK0
$$
Calculate predicted values and residuals for the options
$$
LATEXBLOCK1
$$
Identify the year with the largest absolute residual
$$
LATEXBLOCK2
$$

Snap & solve any problem in the app
Get step-by-step solutions on Sovi AI
Photo-based solutions with guided steps
Explore more problems and detailed explanations
- 1985
- 1992 (Correct answer)
- 2000
- 2012