QUESTION IMAGE
Question
study the who are americans? infographic, and then answer the question.
order the digital media platforms from the one reported the most used to the one reported the least used to consume political news and information.
start by choosing the first item in the sequence and clicking, dragging, or using your keyboard to select it.
podcasts
social media
news websites or apps
Analyze the infographic data
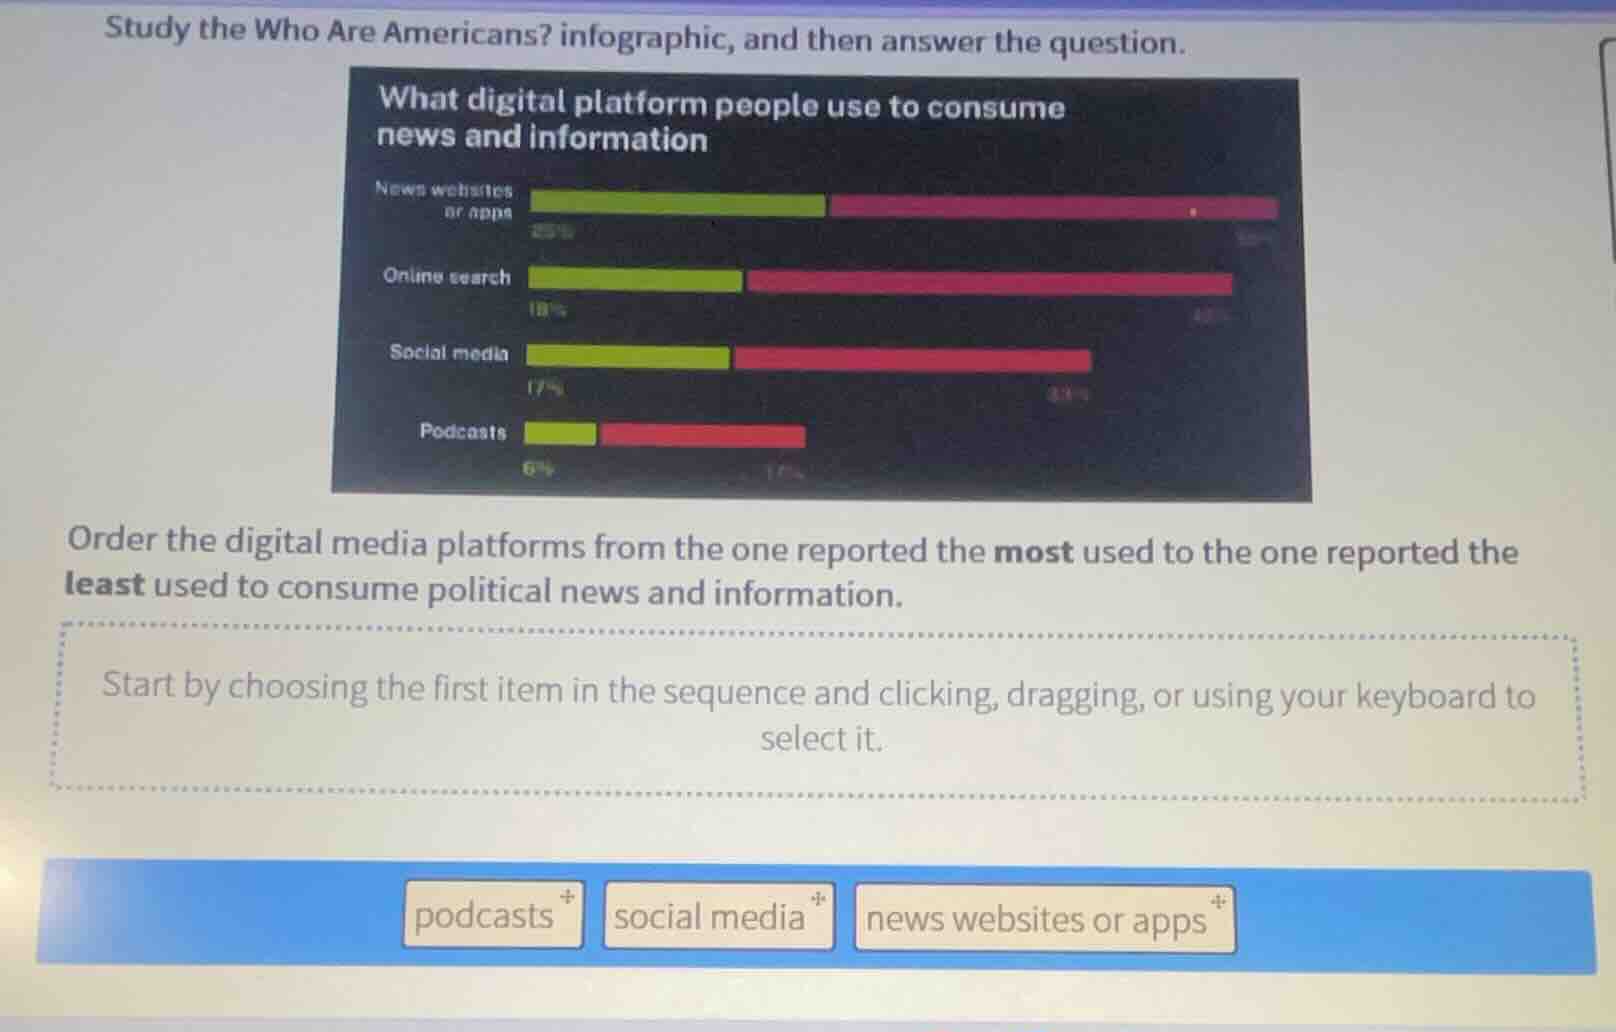
The bar chart displays the percentage of people using different digital platforms to consume news and information:
- News websites or apps: \(25\%\) (often/regularly, represented by the green bar segment) with a total reach extending to \(48\%\)
- Online search: \(18\%\) (often/regularly) with a total reach extending to \(43\%\)
- Social media: \(17\%\) (often/regularly) with a total reach extending to \(37\%\)
- Podcasts: \(6\%\) (often/regularly) with a total reach extending to \(15\%\)
Order the given platforms from most used to least used
Comparing the usage levels of the three options provided at the bottom of the screen:
- news websites or apps (\(25\%\) often, \(48\%\) total)
- social media (\(17\%\) often, \(37\%\) total)
- podcasts (\(6\%\) often, \(15\%\) total)

Snap & solve any problem in the app
Get step-by-step solutions on Sovi AI
Photo-based solutions with guided steps
Explore more problems and detailed explanations
- news websites or apps
- social media
- podcasts