QUESTION IMAGE
Question
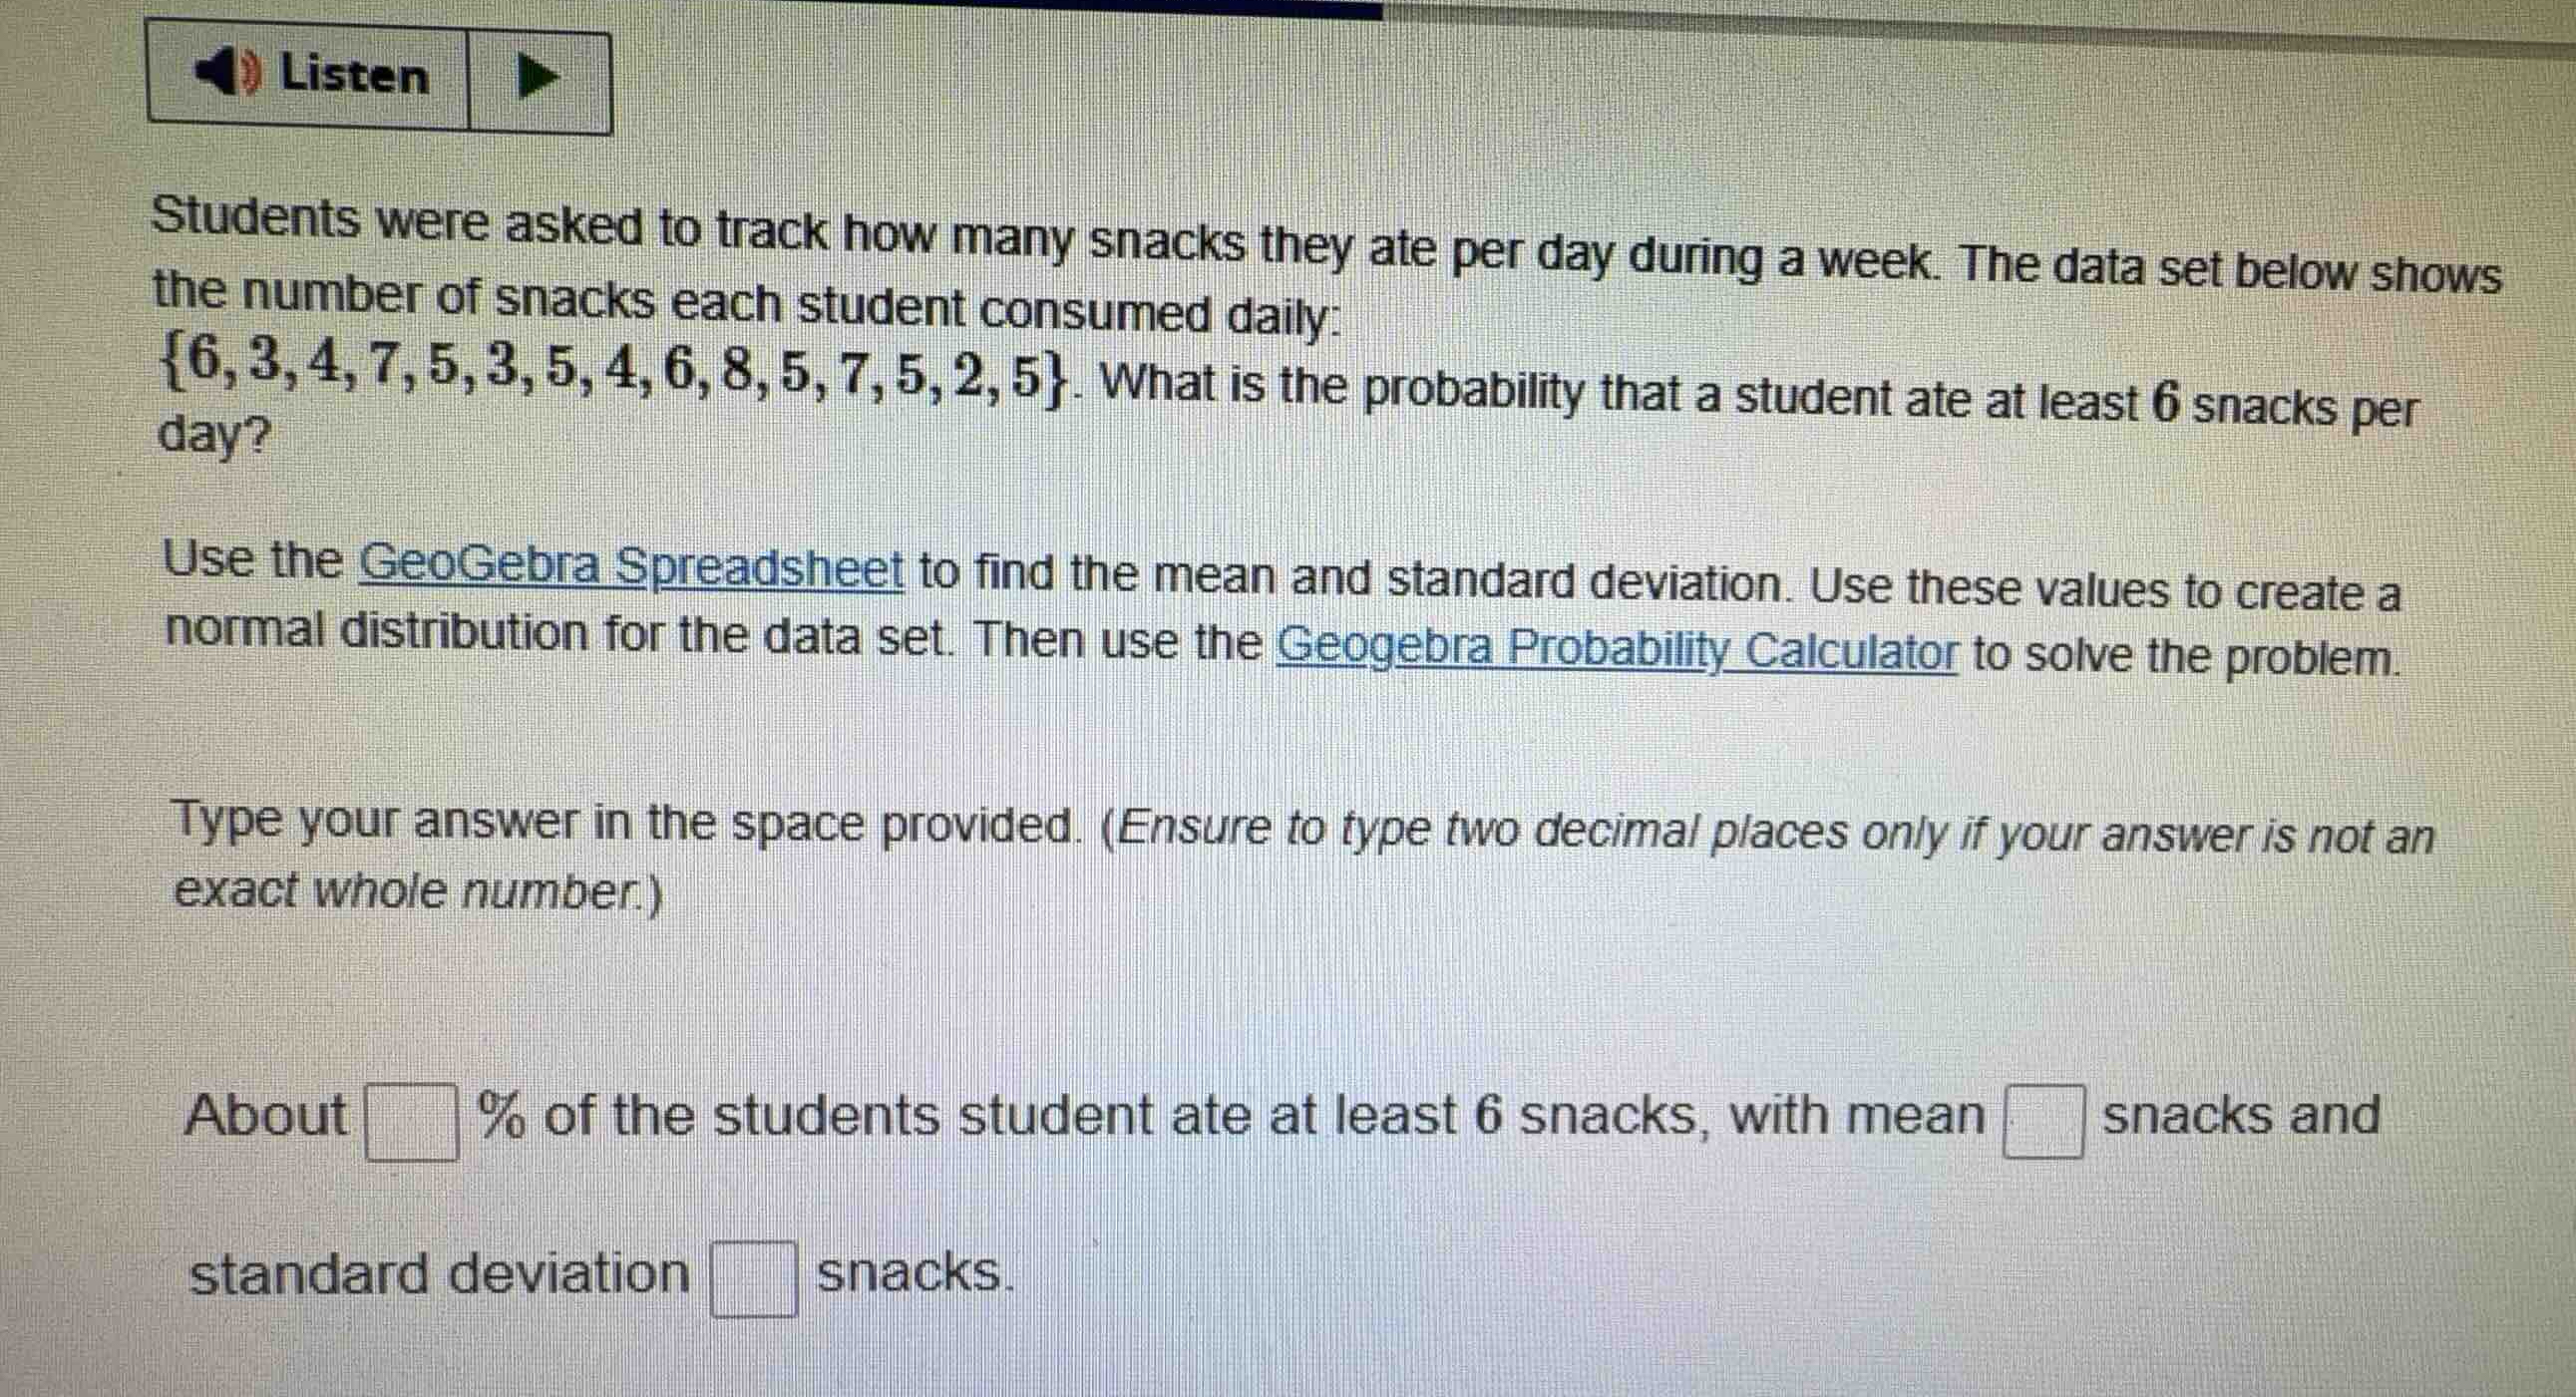
students were asked to track how many snacks they ate per day during a week. the data set below shows the number of snacks each student consumed daily:
\\{6, 3, 4, 7, 5, 3, 5, 4, 6, 8, 5, 7, 5, 2, 5\\}. what is the probability that a student ate at least 6 snacks per day?
use the geogebra spreadsheet to find the mean and standard deviation. use these values to create a normal distribution for the data set. then use the geogebra probability calculator to solve the problem.
type your answer in the space provided. (ensure to type two decimal places only if your answer is not an exact whole number.)
about % of the students student ate at least 6 snacks, with mean snacks and standard deviation snacks.
Calculate the sample mean
Using the Sample Mean knowledge point
Calculate the sample standard deviation
Using the Sample Standard Deviation knowledge point
Calculate the normal distribution probability
Using the Normal Distribution Probability knowledge point

Snap & solve any problem in the app
Get step-by-step solutions on Sovi AI
Photo-based solutions with guided steps
Explore more problems and detailed explanations
About <blank>27.19</blank> % of the students ate at least 6 snacks, with mean <blank>5</blank> snacks and standard deviation <blank>1.65</blank> snacks.