QUESTION IMAGE
Question
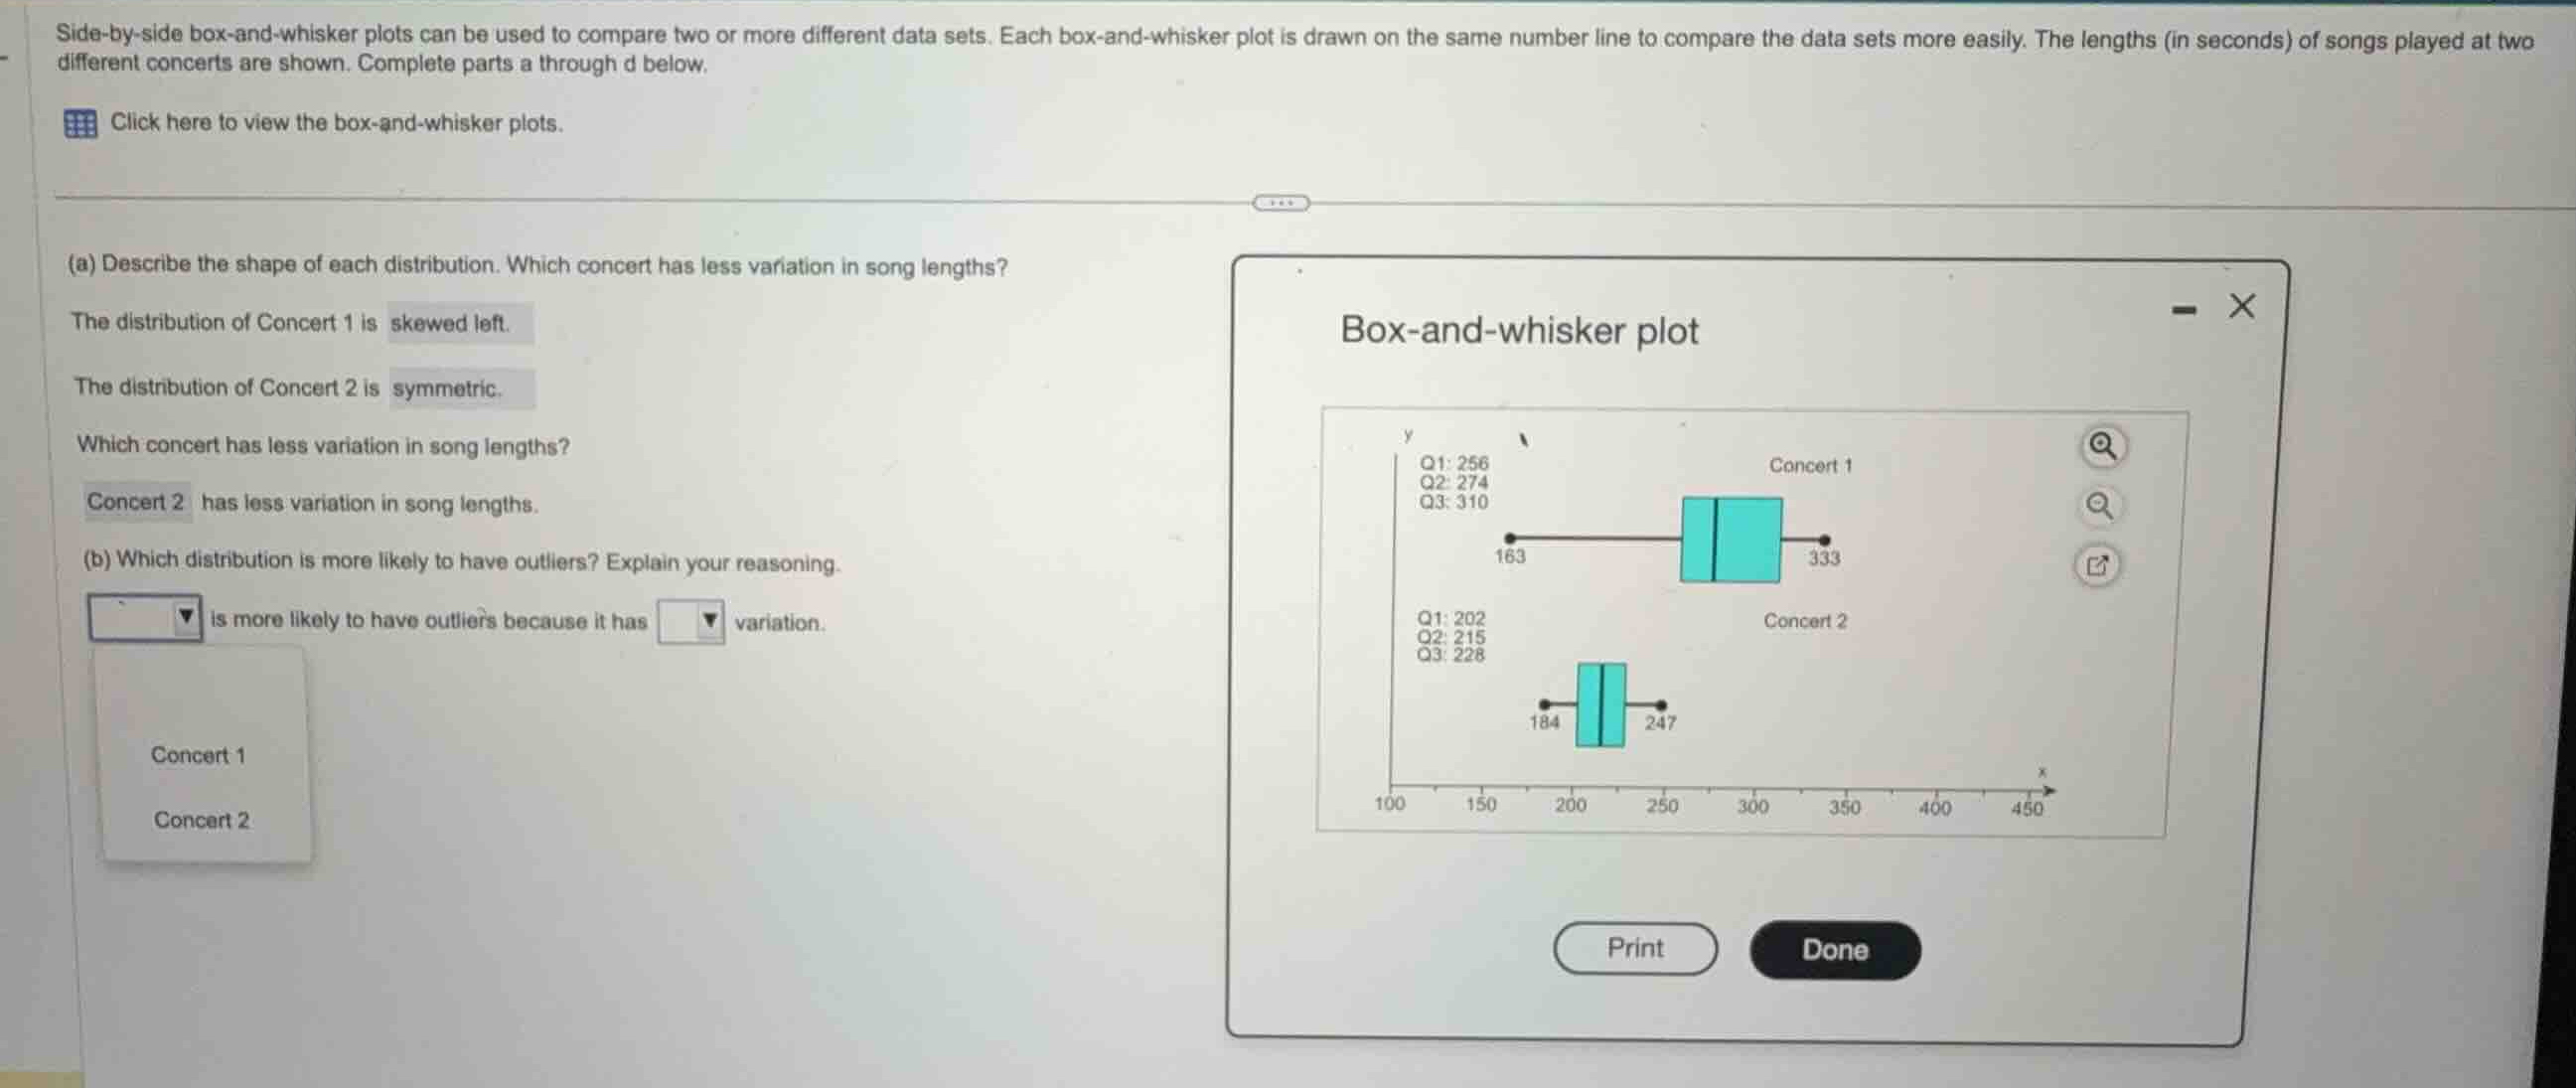
side-by-side box-and-whisker plots can be used to compare two or more different data sets. each box-and-whisker plot is drawn on the same number line to compare the data sets more easily. the lengths (in seconds) of songs played at two different concerts are shown. complete parts a through d below.
(a) describe the shape of each distribution. which concert has less variation in song lengths?
the distribution of concert 1 is skewed left.
the distribution of concert 2 is symmetric.
which concert has less variation in song lengths?
concert 2 has less variation in song lengths.
(b) which distribution is more likely to have outliers? explain your reasoning.
is more likely to have outliers because it has variation.
Analyze the box-and-whisker plots
Using the Box-and-Whisker Plot knowledge point
Compare variation and outlier likelihood
Using the Measures of Variation knowledge point
Concert 1 has much greater variation (spread) than Concert 2. A larger spread/variation increases the likelihood of having extreme values or outliers.
Fill in the blanks
The first dropdown asks which concert is more likely to have outliers. Based on the variation comparison, Concert 1 is more likely to have outliers because it has greater variation.

Snap & solve any problem in the app
Get step-by-step solutions on Sovi AI
Photo-based solutions with guided steps
Explore more problems and detailed explanations
<blank>Concert 1</blank> is more likely to have outliers because it has <blank>greater</blank> variation.