QUESTION IMAGE
Question
select the correct location on the image.
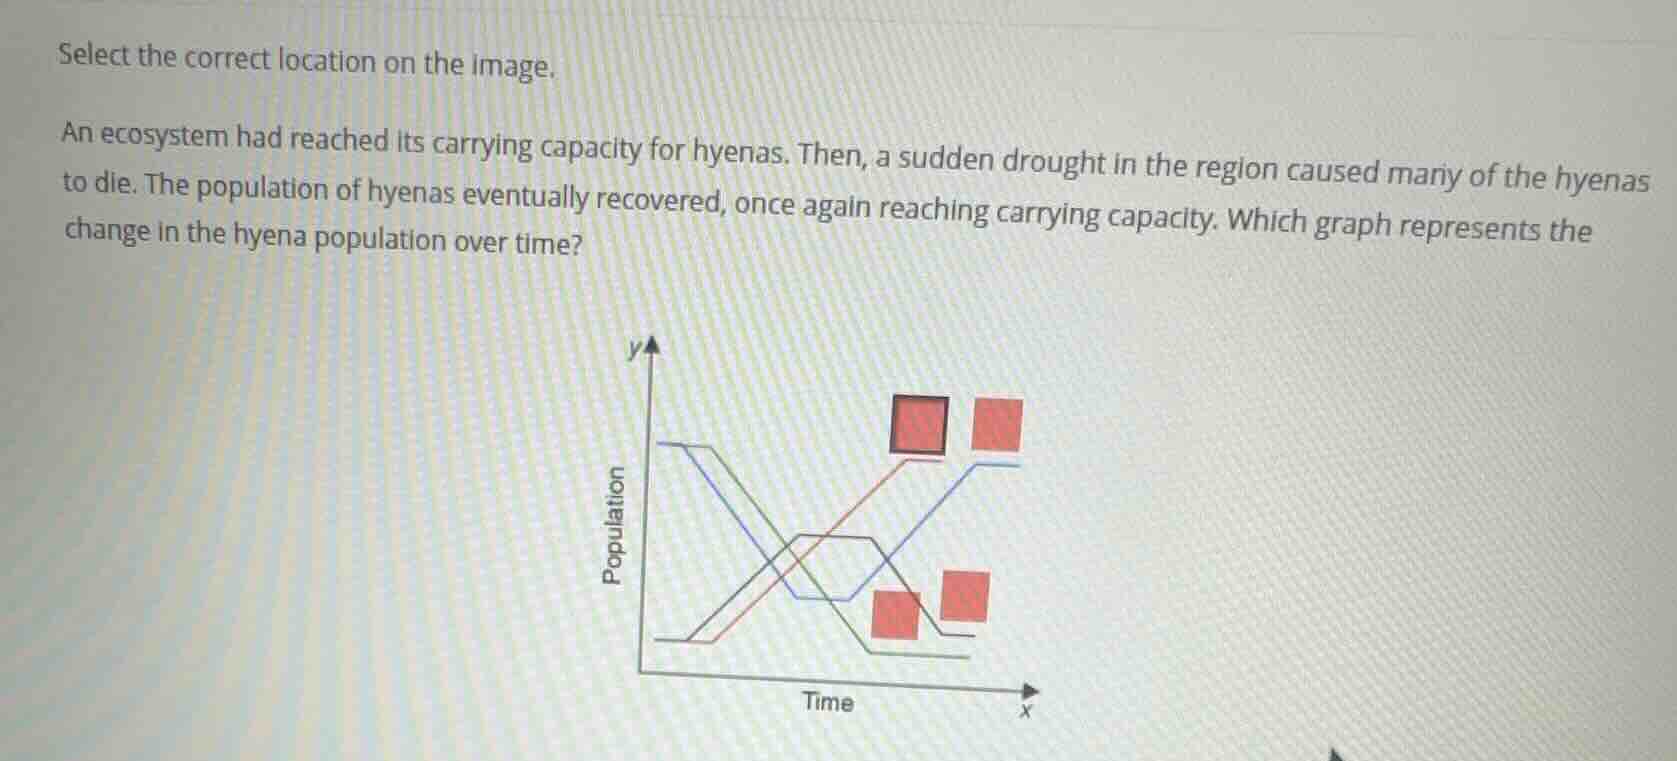
an ecosystem had reached its carrying capacity for hyenas. then, a sudden drought in the region caused many of the hyenas to die. the population of hyenas eventually recovered, once again reaching carrying capacity. which graph represents the change in the hyena population over time?
Analyze the initial state
The problem states that the hyena population had already reached its carrying capacity. This means the graph must start at a high, stable level (a horizontal plateau representing carrying capacity).
Analyze the disturbance
Next, a sudden drought occurs, causing many hyenas to die. This means the population must decrease sharply, represented by a downward slope on the graph to a lower level.
Analyze the recovery
Finally, the population eventually recovered, once again reaching carrying capacity. This means the population must increase back up to the original high, stable level (a horizontal plateau).
Identify the matching curve
Let's trace the curves shown in the image:
- One curve (blue) starts high, drops down to a lower level, and then rises back up to the original high level.
- Another curve starts low, rises, plateaus, and then drops.
- Another curve starts high, drops, and stays low.
- Another curve starts low, rises, and stays high.
The blue curve that starts high, dips down, and returns to its high level perfectly matches the sequence: carrying capacity $
ightarrow$ drought decline $
ightarrow$ recovery to carrying capacity. The red selection box pointing to this blue curve is the top-right box.

Snap & solve any problem in the app
Get step-by-step solutions on Sovi AI
Photo-based solutions with guided steps
Explore more problems and detailed explanations
- Top-left box (pointing to the curve that starts low, rises, and then drops)
- Top-right box (pointing to the blue curve that starts high, drops during the drought, and recovers back to carrying capacity) (Correct answer)
- Bottom-left box (pointing to the curve that starts high, drops, and remains low)
- Bottom-right box (pointing to the curve that starts low, rises, and remains high)