QUESTION IMAGE
Question
select the correct answer.
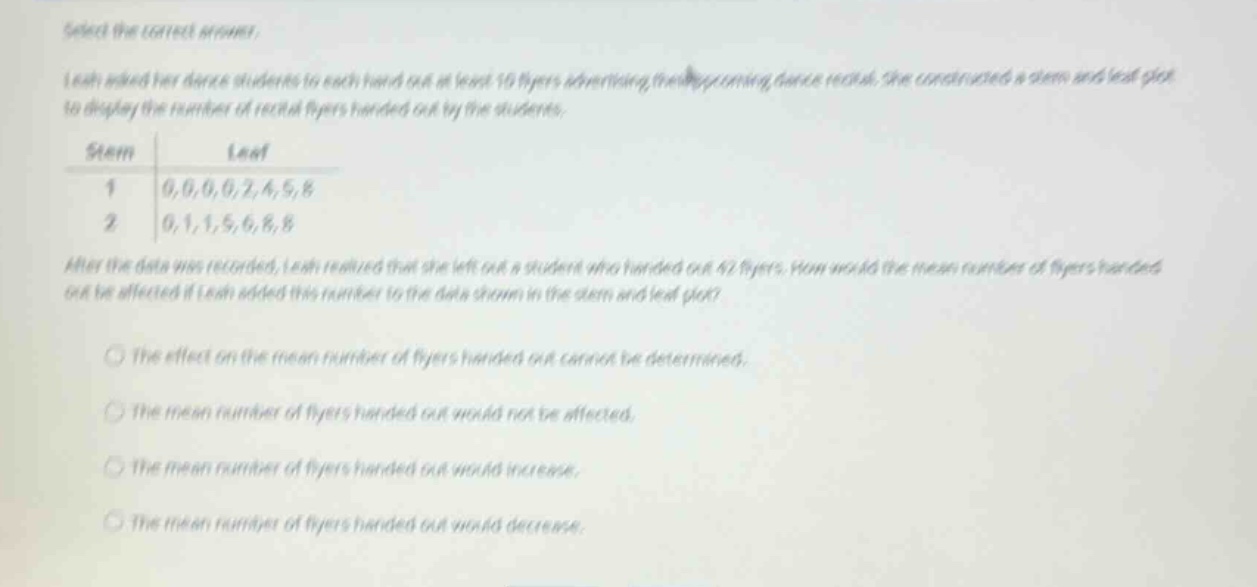
leah asked her dance students to each hand out at least 10 flyers advertising their upcoming dance recital. she constructed a stem-and-leaf plot to display the number of recital flyers handed out by the students.
after the data was recorded, leah realized that she left out a student who handed out 42 flyers. how would the mean number of flyers handed out be affected if leah added this number to the data shown in the stem-and-leaf plot?
- the effect on the mean number of flyers handed out cannot be determined.
- the mean number of flyers handed out would not be affected.
- the mean number of flyers handed out would increase.
- the mean number of flyers handed out would decrease.
🆕 New Concept Discovered: Stem-and-Leaf Plots and Mean
How adding data values affects the average
Step 1: Extract the original data
From the stem-and-leaf plot, we read the values by combining each stem with its leaves:
- Stem 1: \(10, 10, 10, 10, 12, 14, 15, 18\)
- Stem 2: \(20, 21, 21, 25, 26, 28, 28\)
All original data values are between \(10\) and \(28\).
Step 2: Analyze the effect of the new value
The original mean must lie within the range of the original data:
The new student's value is \(42\).
Since \(42\) is strictly greater than any value in the original dataset (and thus strictly greater than the original mean), adding this value to the dataset will pull the average upward.

Snap & solve any problem in the app
Get step-by-step solutions on Sovi AI
Photo-based solutions with guided steps
Explore more problems and detailed explanations
The mean number of flyers handed out would increase.