QUESTION IMAGE
Question
science exercises graphing & data tables.pdf
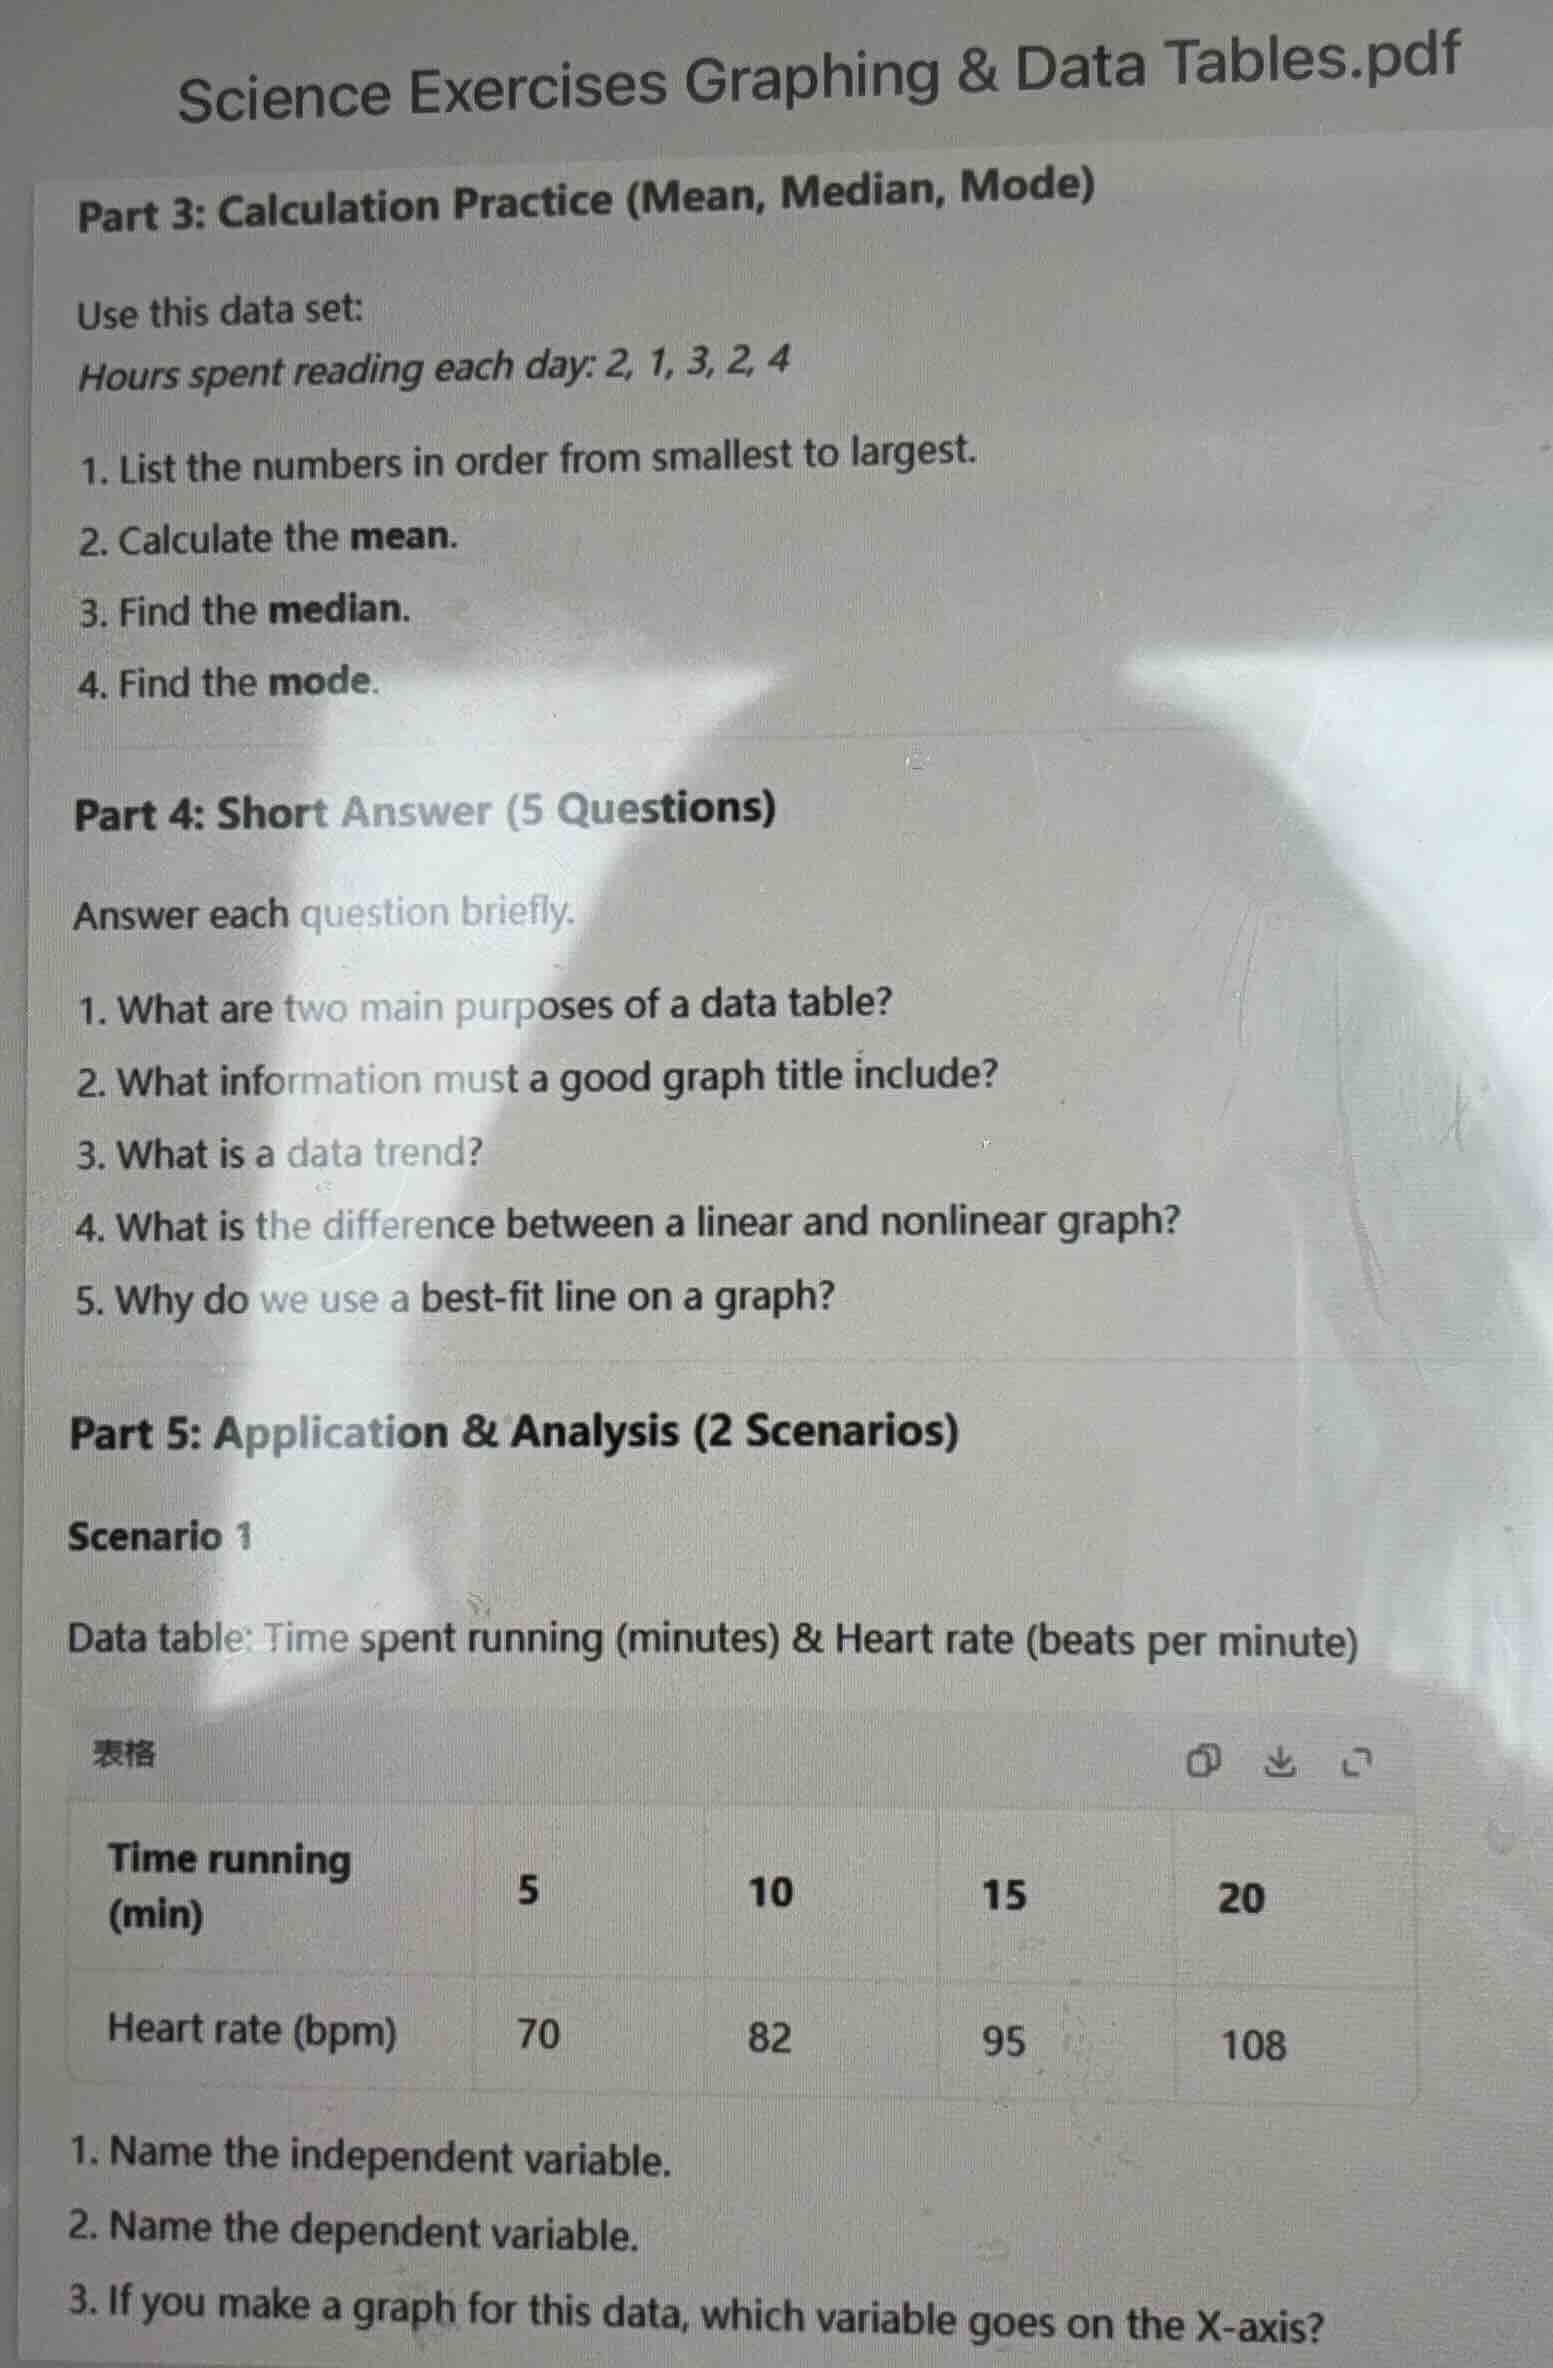
part 3: calculation practice (mean, median, mode)
use this data set:
hours spent reading each day: 2, 1, 3, 2, 4
- list the numbers in order from smallest to largest.
- calculate the mean.
- find the median.
- find the mode.
part 4: short answer (5 questions)
answer each question briefly.
- what are two main purposes of a data table?
- what information must a good graph title include?
- what is a data trend?
- what is the difference between a linear and nonlinear graph?
- why do we use a best-fit line on a graph?
part 5: application & analysis (2 scenarios)
scenario 1
data table: time spent running (minutes) & heart rate (beats per minute)
time running (min): 5, 10, 15, 20
heart rate (bpm): 70, 82, 95, 108
- name the independent variable.
- name the dependent variable.
- if you make a graph for this data, which variable goes on the x-axis?
Part 3: Calculation Practice
$$
LATEXBLOCK0
$$
Part 4: Short Answer
$$
LATEXBLOCK1
$$
Part 5: Application & Analysis (Scenario 1)
$$
LATEXBLOCK2
$$

Snap & solve any problem in the app
Get step-by-step solutions on Sovi AI
Photo-based solutions with guided steps
Explore more problems and detailed explanations
Part 3: Calculation Practice (Mean, Median, Mode)
- Ordered data: 1, 2, 2, 3, 4
- Mean: 2.4
- Median: 2
- Mode: 2
Part 4: Short Answer (5 Questions)
- Two main purposes of a data table are to organize collected data systematically and to make it easy to read and compare values.
- A good graph title must include both the independent variable and the dependent variable (typically written as "The Effect of [Independent Variable] on [Dependent Variable]").
- A data trend is the general pattern or direction in which data points move (such as increasing, decreasing, or staying constant).
- A linear graph shows a relationship that forms a straight line, whereas a nonlinear graph shows a relationship that forms a curve.
- We use a best-fit line to reveal the overall trend of the data points and to make predictions for values not directly measured.
Part 5: Application & Analysis (Scenario 1)
- Independent variable: Time running (min)
- Dependent variable: Heart rate (bpm)
- Variable on the X-axis: Time running (min)