QUESTION IMAGE
Question
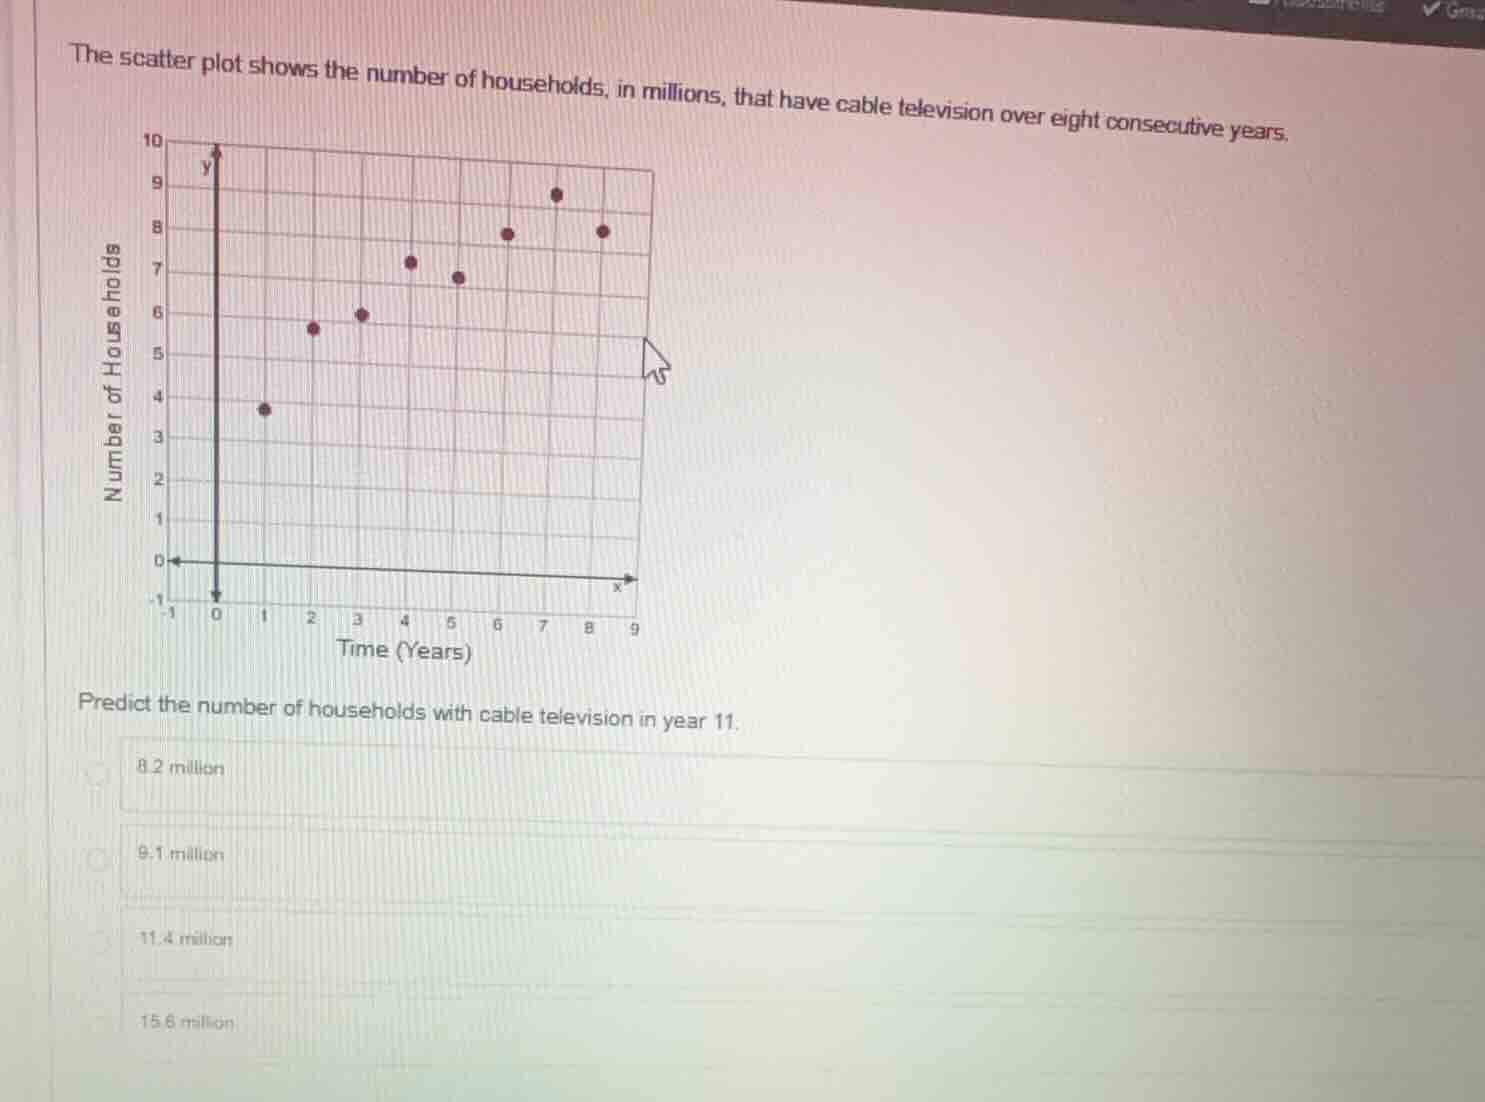
the scatter plot shows the number of households, in millions, that have cable television over eight consecutive years.
predict the number of households with cable television in year 11.
8.2 million
9.1 million
11.4 million
15.6 million
Identify the coordinates of the data points
$$
(1, 3.8), (2, 5.7), (3, 6.0), (4, 7.3), (5, 7.0), (6, 8.0), (7, 9.0), (8, 8.2)
$$
Calculate the line of best fit
$$
LATEXBLOCK0
$$
Predict the value at year 11
$$
LATEXBLOCK1
$$
Comparing with the options:
- \(8.2 \text{ million}\)
- \(9.1 \text{ million}\)
- \(11.4 \text{ million}\)
- \(15.6 \text{ million}\)
Using a simplified visual trend line passing through approximately \((2, 5.7)\) and \((7, 9.0)\):
$$
LATEXBLOCK2
$$
Thus, \(11.4 \text{ million}\) is the most reasonable prediction.

Snap & solve any problem in the app
Get step-by-step solutions on Sovi AI
Photo-based solutions with guided steps
Explore more problems and detailed explanations
- 8.2 million
- 9.1 million
- 11.4 million (Correct answer)
- 15.6 million