QUESTION IMAGE
Question
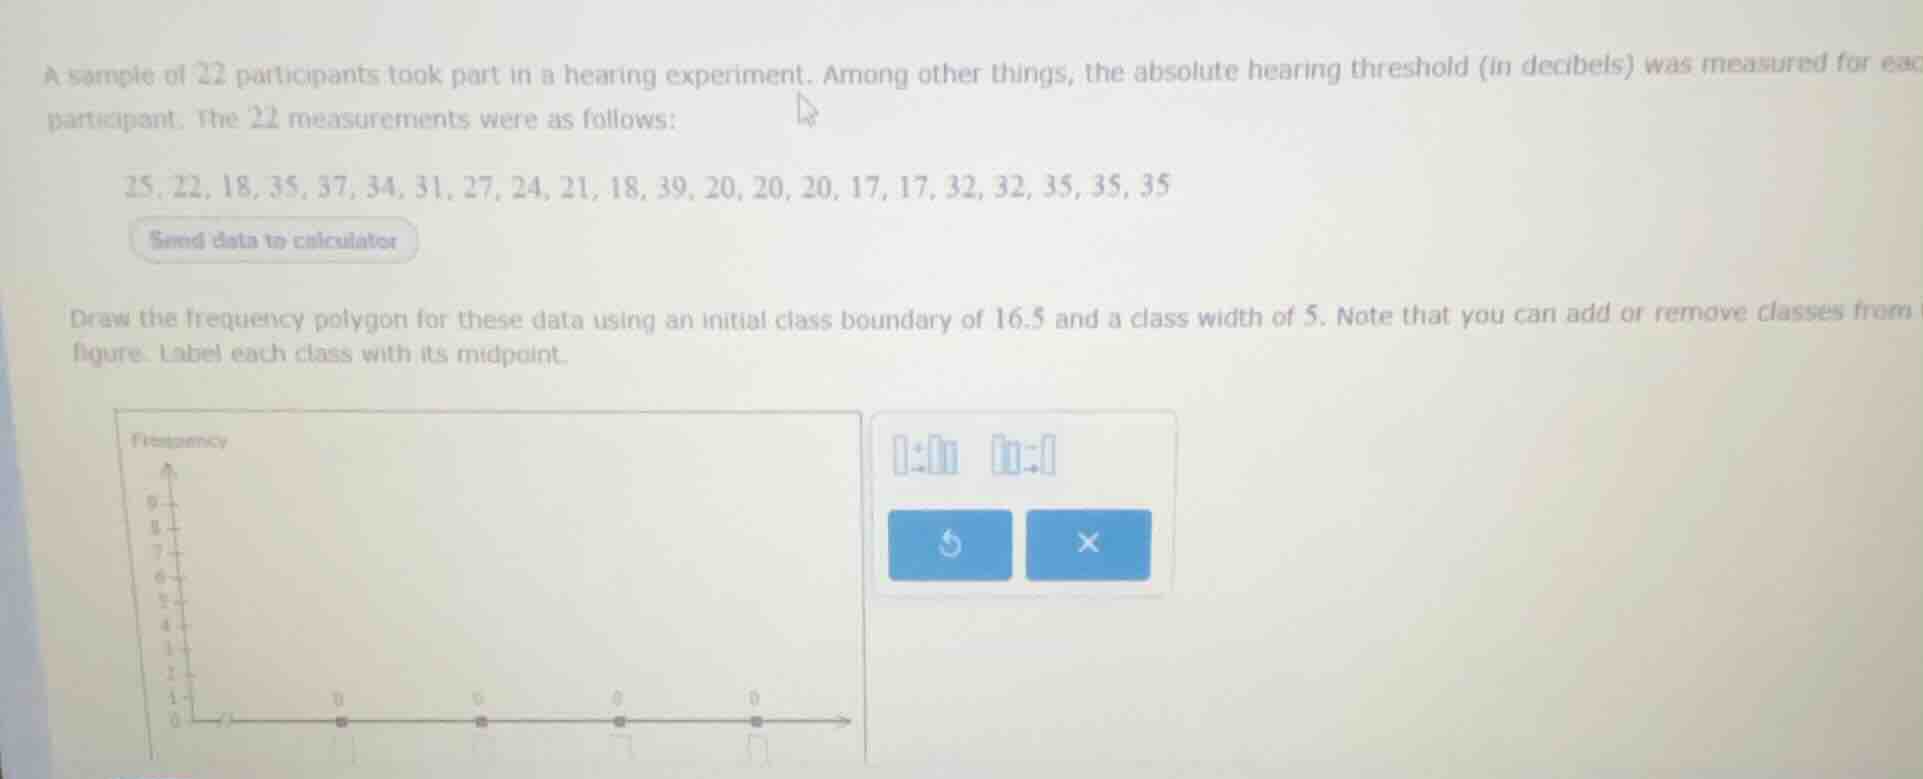
a sample of 22 participants took part in a hearing experiment. among other things, the absolute hearing threshold (in decibels) was measured for each participant. the 22 measurements were as follows:
25, 22, 18, 35, 37, 34, 31, 27, 24, 21, 18, 39, 20, 20, 20, 17, 17, 32, 32, 35, 35, 35
draw the frequency polygon for these data using an initial class boundary of 16.5 and a class width of 5. note that you can add or remove classes from the figure. label each class with its midpoint.
Determine the classes, midpoints, and frequencies
Given data (22 measurements):
\(25, 22, 18, 35, 37, 34, 31, 27, 24, 21, 18, 39, 20, 20, 20, 17, 17, 32, 32, 35, 35, 35\)
Sorted data:
\(17, 17, 18, 18, 20, 20, 20, 21, 22, 24, 25, 27, 31, 32, 32, 34, 35, 35, 35, 35, 37, 39\)
Class boundaries starting at \(16.5\) with width \(5\):
- Class 1: \(16.5 - 21.5\)
- Data points: \(17, 17, 18, 18, 20, 20, 20, 21\) (8 values)
- Midpoint: \(\frac{16.5 + 21.5}{2} = 19\)
- Frequency: \(8\)
- Class 2: \(21.5 - 26.5\)
- Data points: \(22, 24, 25\) (3 values)
- Midpoint: \(\frac{21.5 + 26.5}{2} = 24\)
- Frequency: \(3\)
- Class 3: \(26.5 - 31.5\)
- Data points: \(27, 31\) (2 values)
- Midpoint: \(\frac{26.5 + 31.5}{2} = 29\)
- Frequency: \(2\)
- Class 4: \(31.5 - 36.5\)
- Data points: \(32, 32, 34, 35, 35, 35, 35\) (7 values)
- Midpoint: \(\frac{31.5 + 36.5}{2} = 34\)
- Frequency: \(7\)
- Class 5: \(36.5 - 41.5\)
- Data points: \(37, 39\) (2 values)
- Midpoint: \(\frac{36.5 + 41.5}{2} = 39\)
- Frequency: \(2\)
Anchor the frequency polygon to zero
To complete the frequency polygon, anchor it to the horizontal axis (frequency of 0) at the midpoints of the immediate preceding and succeeding classes:
- Preceding anchor midpoint: \(19 - 5 = 14\) (Frequency: \(0\))
- Succeeding anchor midpoint: \(39 + 5 = 44\) (Frequency: \(0\))
Summarize the coordinates for plotting
The points to plot and connect with straight lines are:

Snap & solve any problem in the app
Get step-by-step solutions on Sovi AI
Photo-based solutions with guided steps
Explore more problems and detailed explanations
To construct the frequency polygon, use the following class midpoints and frequencies, anchored to zero at both ends:
| Class Boundaries | Midpoint | Frequency | Coordinate to Plot |
|---|---|---|---|
| \(16.5 - 21.5\) | \(19\) | \(8\) | \((19, 8)\) |
| \(21.5 - 26.5\) | \(24\) | \(3\) | \((24, 3)\) |
| \(26.5 - 31.5\) | \(29\) | \(2\) | \((29, 2)\) |
| \(31.5 - 36.5\) | \(34\) | \(7\) | \((34, 7)\) |
| \(36.5 - 41.5\) | \(39\) | \(2\) | \((39, 2)\) |
| Anchor Class | \(44\) | \(0\) | \((44, 0)\) |
Plot these points on your graph and connect them sequentially with straight line segments.