QUESTION IMAGE
Question
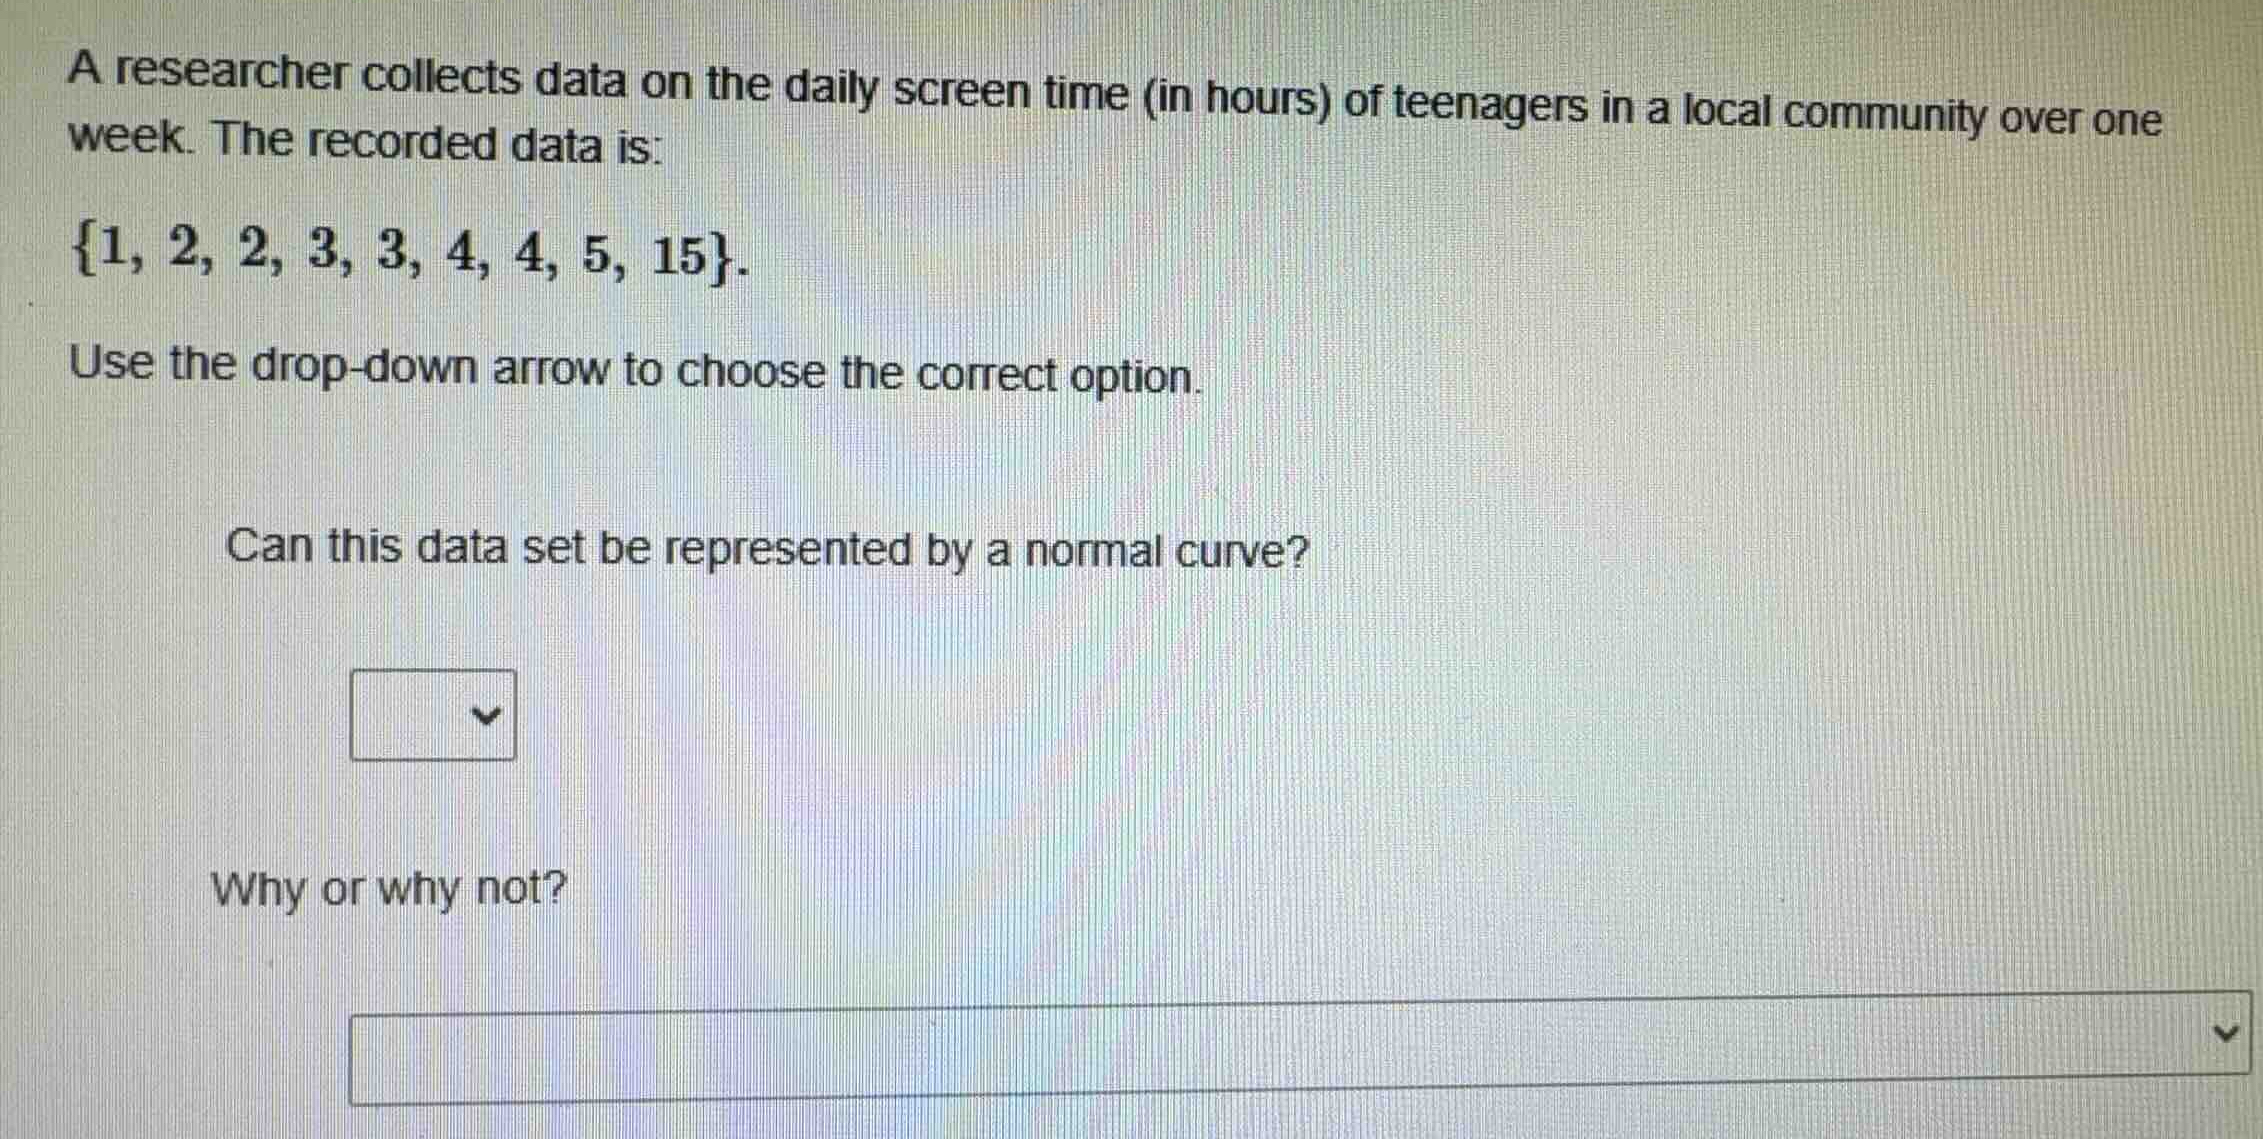
a researcher collects data on the daily screen time (in hours) of teenagers in a local community over one week. the recorded data is:
\\{1, 2, 2, 3, 3, 4, 4, 5, 15\\}.
use the drop-down arrow to choose the correct option.
can this data set be represented by a normal curve?
why or why not?
Analyze data symmetry and outliers
$$
\text{Data set: } \{1, 2, 2, 3, 3, 4, 4, 5, 15\}
$$
$$
\text{Median} = 3
$$
$$
\text{Mean} = \frac{1+2+2+3+3+4+4+5+15}{9} = \frac{39}{9} \approx 4.33
$$
$$
\text{Outlier} = 15 \quad (\text{highly right-skewed})
$$
Evaluate normal distribution suitability
$$
\text{Normal distribution requirement: symmetric, bell-shaped, no extreme outliers.}
$$
$$
\text{Since Mean } (4.33) > \text{ Median } (3) \text{ and } 15 \text{ is an extreme outlier, the data is strongly skewed to the right.}
$$
$$
\text{Conclusion: No, it cannot be represented by a normal curve.}
$$

Snap & solve any problem in the app
Get step-by-step solutions on Sovi AI
Photo-based solutions with guided steps
Explore more problems and detailed explanations
Question 1
No
Question 2
No, because the data set is skewed to the right due to the outlier of 15.