QUESTION IMAGE
Question
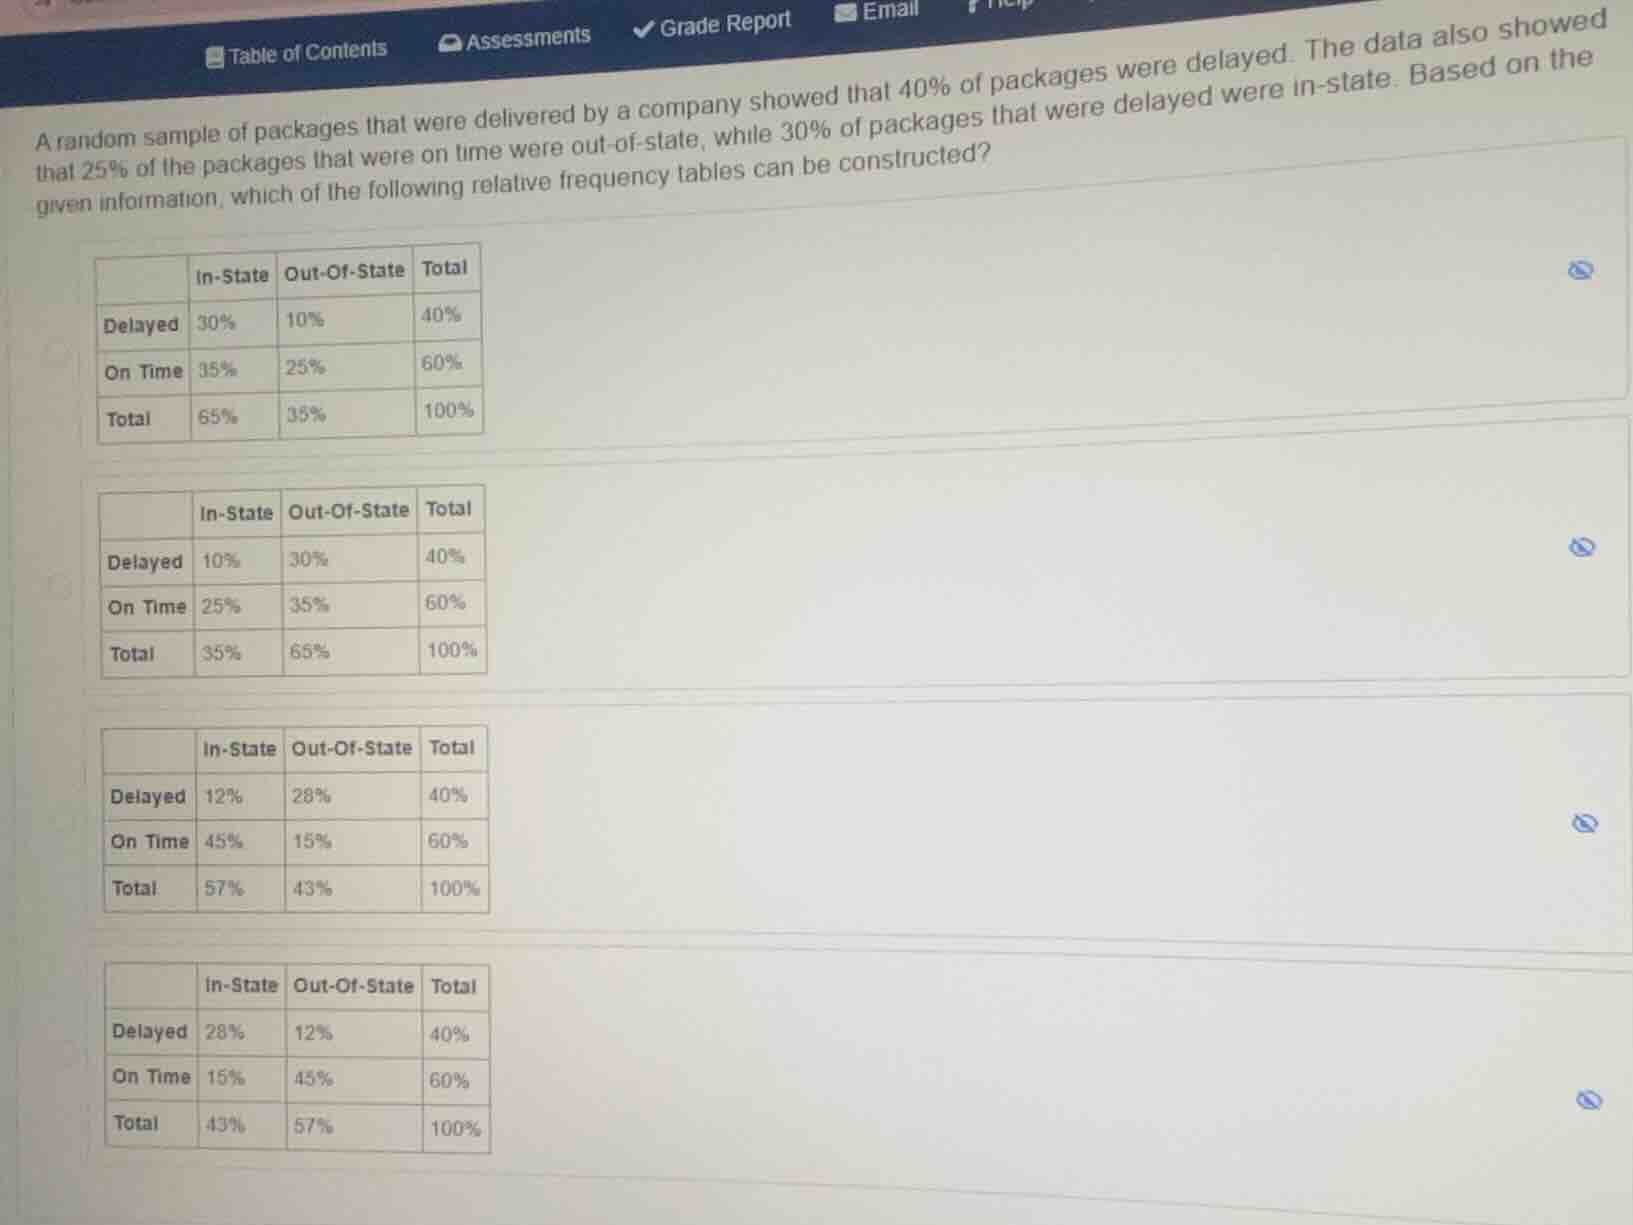
a random sample of packages that were delivered by a company showed that 40% of packages were delayed. the data also showed that 25% of the packages that were on time were out-of-state, while 30% of packages that were delayed were in-state. based on the given information, which of the following relative frequency tables can be constructed?
Step1: Calculate on-time out-of-state %
Given 25% of on-time packages are out-of-state, and on-time packages are 60% of total.
$\text{On-time Out-of-State} = 0.25 \times 0.60 = 0.15 = 15\%$
Step2: Calculate on-time in-state %
Subtract out-of-state on-time from total on-time.
$\text{On-time In-State} = 0.60 - 0.15 = 0.45 = 45\%$
Step3: Calculate delayed in-state %
Given 30% of delayed packages are in-state, and delayed packages are 40% of total.
$\text{Delayed In-State} = 0.30 \times 0.40 = 0.12 = 12\%$
Step4: Calculate delayed out-of-state %
Subtract in-state delayed from total delayed.
$\text{Delayed Out-of-State} = 0.40 - 0.12 = 0.28 = 28\%$
Step5: Calculate total in-state %
Sum on-time and delayed in-state.
$\text{Total In-State} = 0.45 + 0.12 = 0.57 = 57\%$
Step6: Calculate total out-of-state %
Sum on-time and delayed out-of-state.
$\text{Total Out-of-State} = 0.15 + 0.28 = 0.43 = 43\%$

Snap & solve any problem in the app
Get step-by-step solutions on Sovi AI
Photo-based solutions with guided steps
Explore more problems and detailed explanations
The correct table is:
| In-State | Out-Of-State | Total | |
|---|---|---|---|
| On Time | 45% | 15% | 60% |
| Total | 57% | 43% | 100% |