QUESTION IMAGE
Question
question 5 (multiple choice worth 10 points)
(01.03h mc)
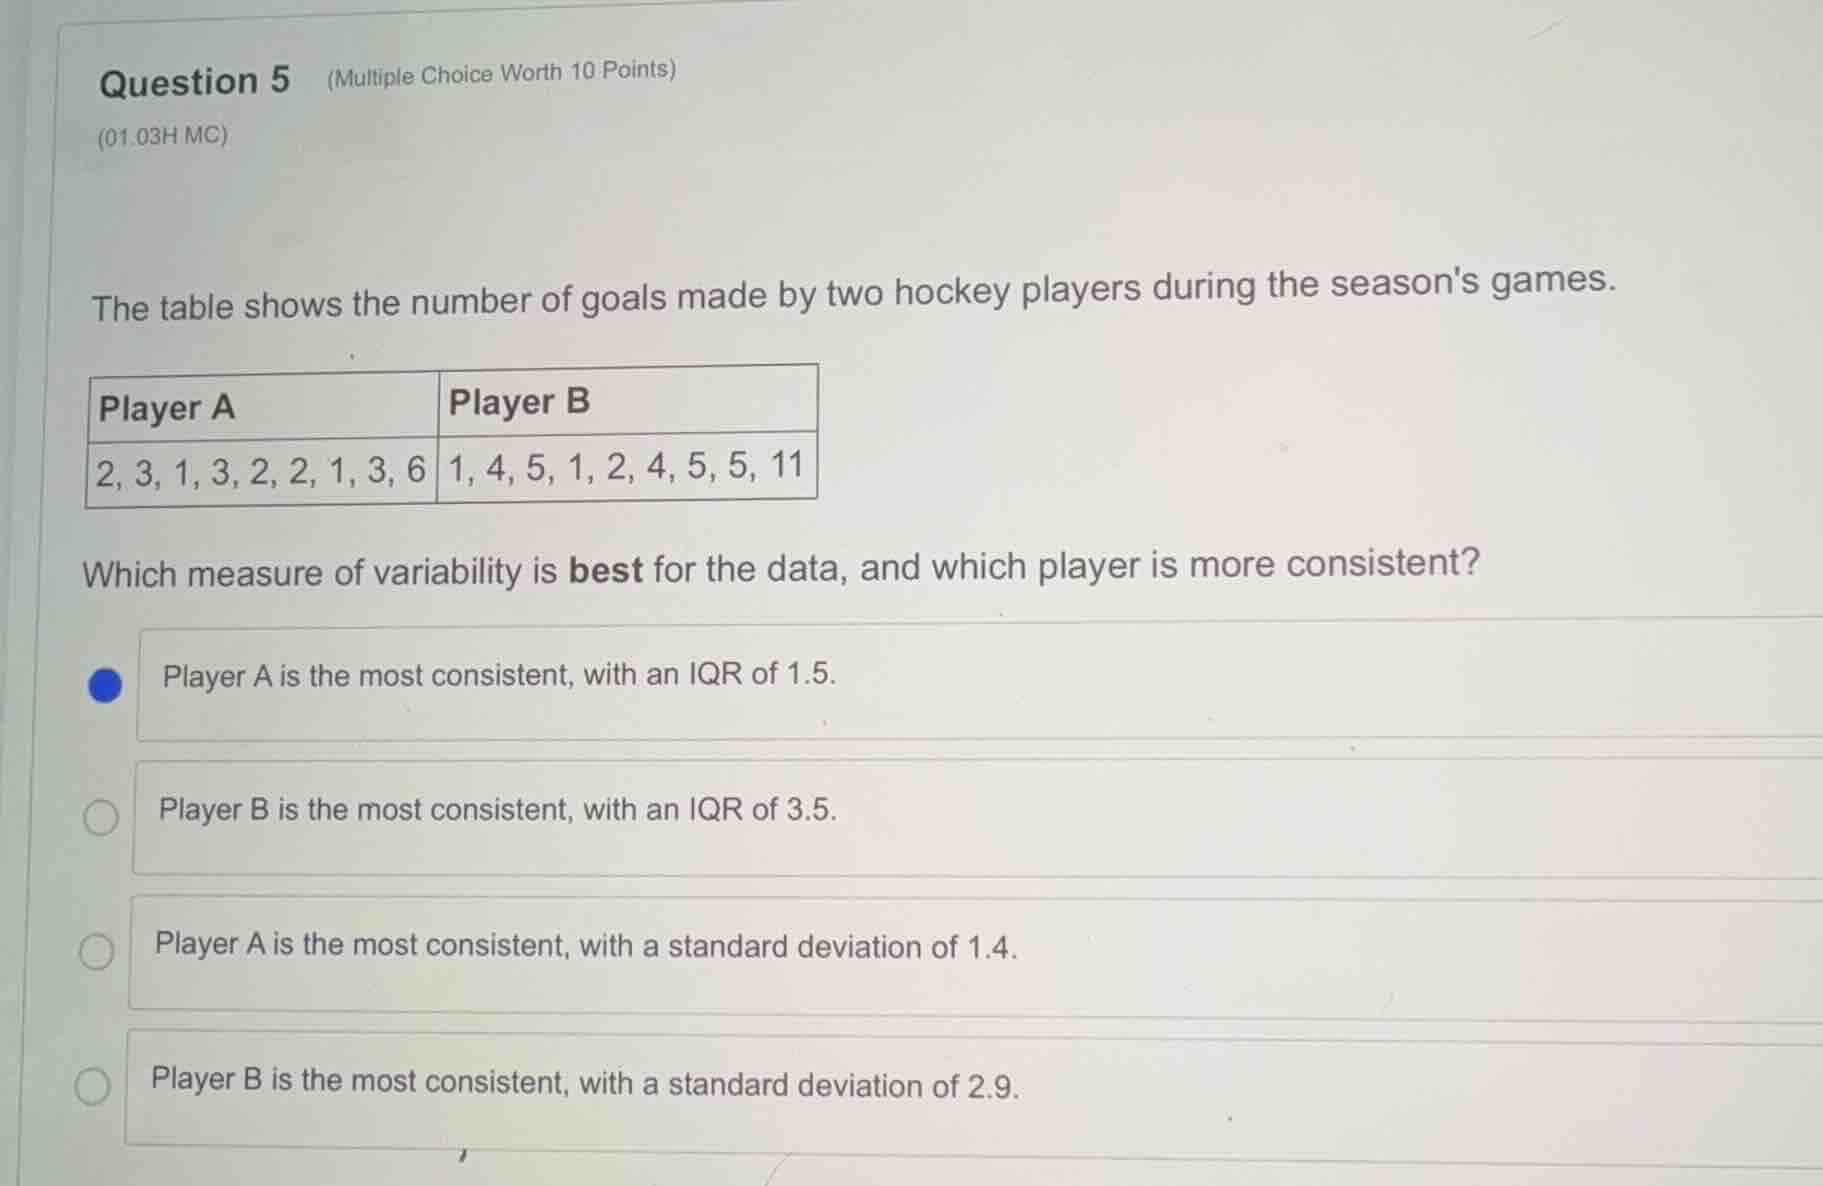
the table shows the number of goals made by two hockey players during the seasons games.
\
$$\begin{tabular}{|l|l|}
\\hline
\\textbf{player a} & \\textbf{player b} \\\\
\\hline
2, 3, 1, 3, 2, 2, 1, 3, 6 & 1, 4, 5, 1, 2, 4, 5, 5, 11 \\\\
\\hline
\\end{tabular}$$
which measure of variability is best for the data, and which player is more consistent?
- player a is the most consistent, with an iqr of 1.5.
- player b is the most consistent, with an iqr of 3.5.
- player a is the most consistent, with a standard deviation of 1.4.
- player b is the most consistent, with a standard deviation of 2.9.
Identify outliers in the datasets
$$
LATEXBLOCK0
$$
Determine the best measure of variability
$$
LATEXBLOCK1
$$
Compare consistency using IQR
$$
LATEXBLOCK2
$$

Snap & solve any problem in the app
Get step-by-step solutions on Sovi AI
Photo-based solutions with guided steps
Explore more problems and detailed explanations
- (A) Player A is the most consistent, with an IQR of 1.5. (Correct answer)
- (B) Player B is the most consistent, with an IQR of 3.5.
- (C) Player A is the most consistent, with a standard deviation of 1.4.
- (D) Player B is the most consistent, with a standard deviation of 2.9.