QUESTION IMAGE
Question
question # 4
multiple choice
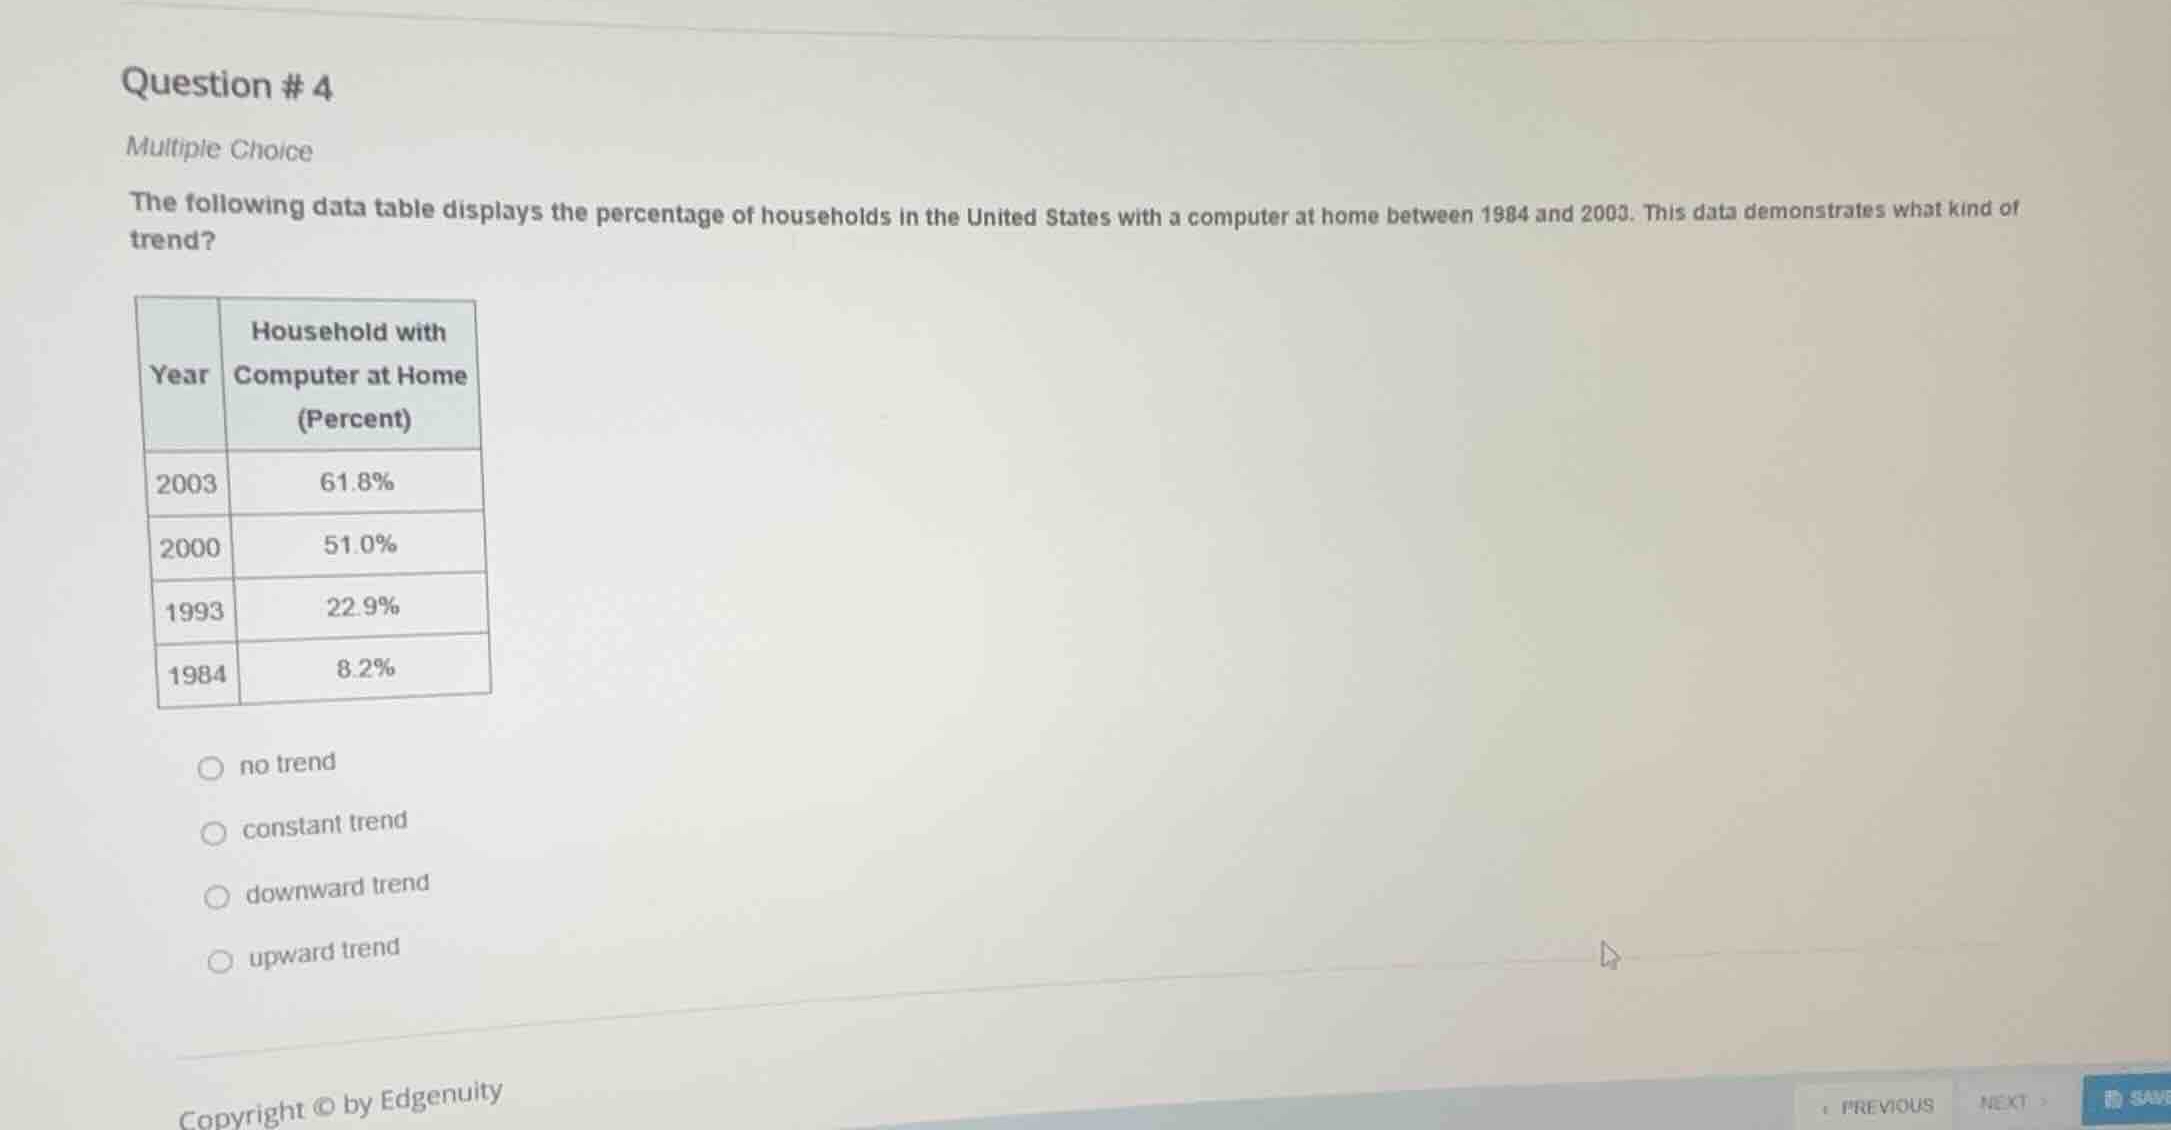
the following data table displays the percentage of households in the united states with a computer at home between 1984 and 2003. this data demonstrates what kind of trend?
| year | household with computer at home (percent) |
|---|---|
| 2000 | 51.0% |
| 1993 | 22.9% |
| 1984 | 8.2% |
- no trend
- constant trend
- downward trend
- upward trend
Analyze the data table
Using the Data Analysis knowledge point
- In 1984, the percentage of households with a computer was \(8.2\%\).
- In 1993, the percentage rose to \(22.9\%\).
- In 2000, the percentage rose to \(51.0\%\).
- In 2003, the percentage rose to \(61.8\%\).
Determine the trend
Using the Statistical Relationships knowledge point
- As the years progress from 1984 to 2003, the percentage consistently increases.
- An increasing pattern over time represents an upward trend.
Evaluate the options
- "no trend": Incorrect, as there is a clear, consistent direction.
- "constant trend": Incorrect, as the values are changing significantly.
- "downward trend": Incorrect, as the values are increasing, not decreasing.
- "upward trend": Correct, as the percentage increases over time.

Snap & solve any problem in the app
Get step-by-step solutions on Sovi AI
Photo-based solutions with guided steps
Explore more problems and detailed explanations
- no trend
- constant trend
- downward trend
- upward trend (Correct answer)