QUESTION IMAGE
Question
question 31 points 2
which of the following is true about the distribution shown below?
parasailing costs ($)
bi-modal
skewed left
Analyze the dot plot
Using the Dot Plot Interpretation knowledge point
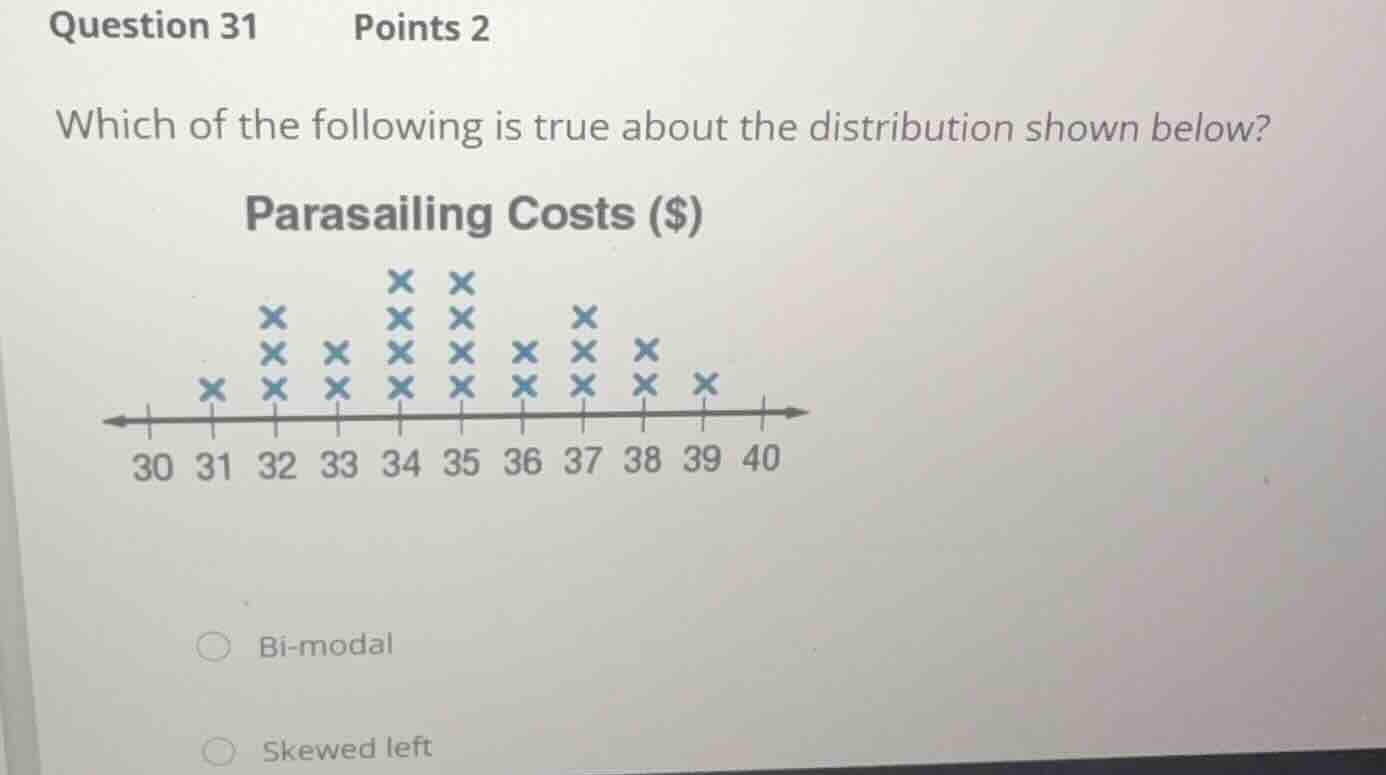
The dot plot shows the frequency of parasailing costs from \$30 to \$40. Let's list the frequencies (number of 'x' marks) for each value:
- 31: 1
- 32: 3
- 33: 2
- 34: 4
- 35: 4
- 36: 2
- 37: 3
- 38: 2
- 39: 1
Evaluate distribution shape
Using the Symmetric Distribution knowledge point
Let's check the symmetry of the distribution around its center. The center of the data range is at 35.
- Frequencies at equal distances from 35:
- 34 and 35 both have 4.
- 33 and 36 both have 2.
- 32 and 37 both have 3.
- 31 and 38 have 1 and 2 respectively (very close to symmetric).
- 30 and 39 have 0 and 1 respectively.
The overall shape is balanced on both sides, indicating a symmetric distribution rather than a skewed one.
Evaluate modality
Using the Bimodal Distribution knowledge point
A bimodal distribution has two distinct peaks (local maxima) separated by a valley.
- Here, the highest frequency is 4, which occurs at both 34 and 35.
- These two peaks are adjacent to each other, forming a single central peak area rather than two separated peaks.
- Therefore, the distribution is unimodal (symmetric and bell-shaped), not bi-modal.
Determine the correct option
Since the distribution is symmetric and bell-shaped, it is best described as symmetric.
- "Bi-modal" is incorrect because there are no two separated peaks.
- "Skewed left" is incorrect because the tail is not stretched to the left.
- "Symmetric" is the correct description of this balanced, bell-like shape.

Snap & solve any problem in the app
Get step-by-step solutions on Sovi AI
Photo-based solutions with guided steps
Explore more problems and detailed explanations
- Bi-modal
- Skewed left
- Symmetric (Correct answer)