QUESTION IMAGE
Question
question 17 of 25
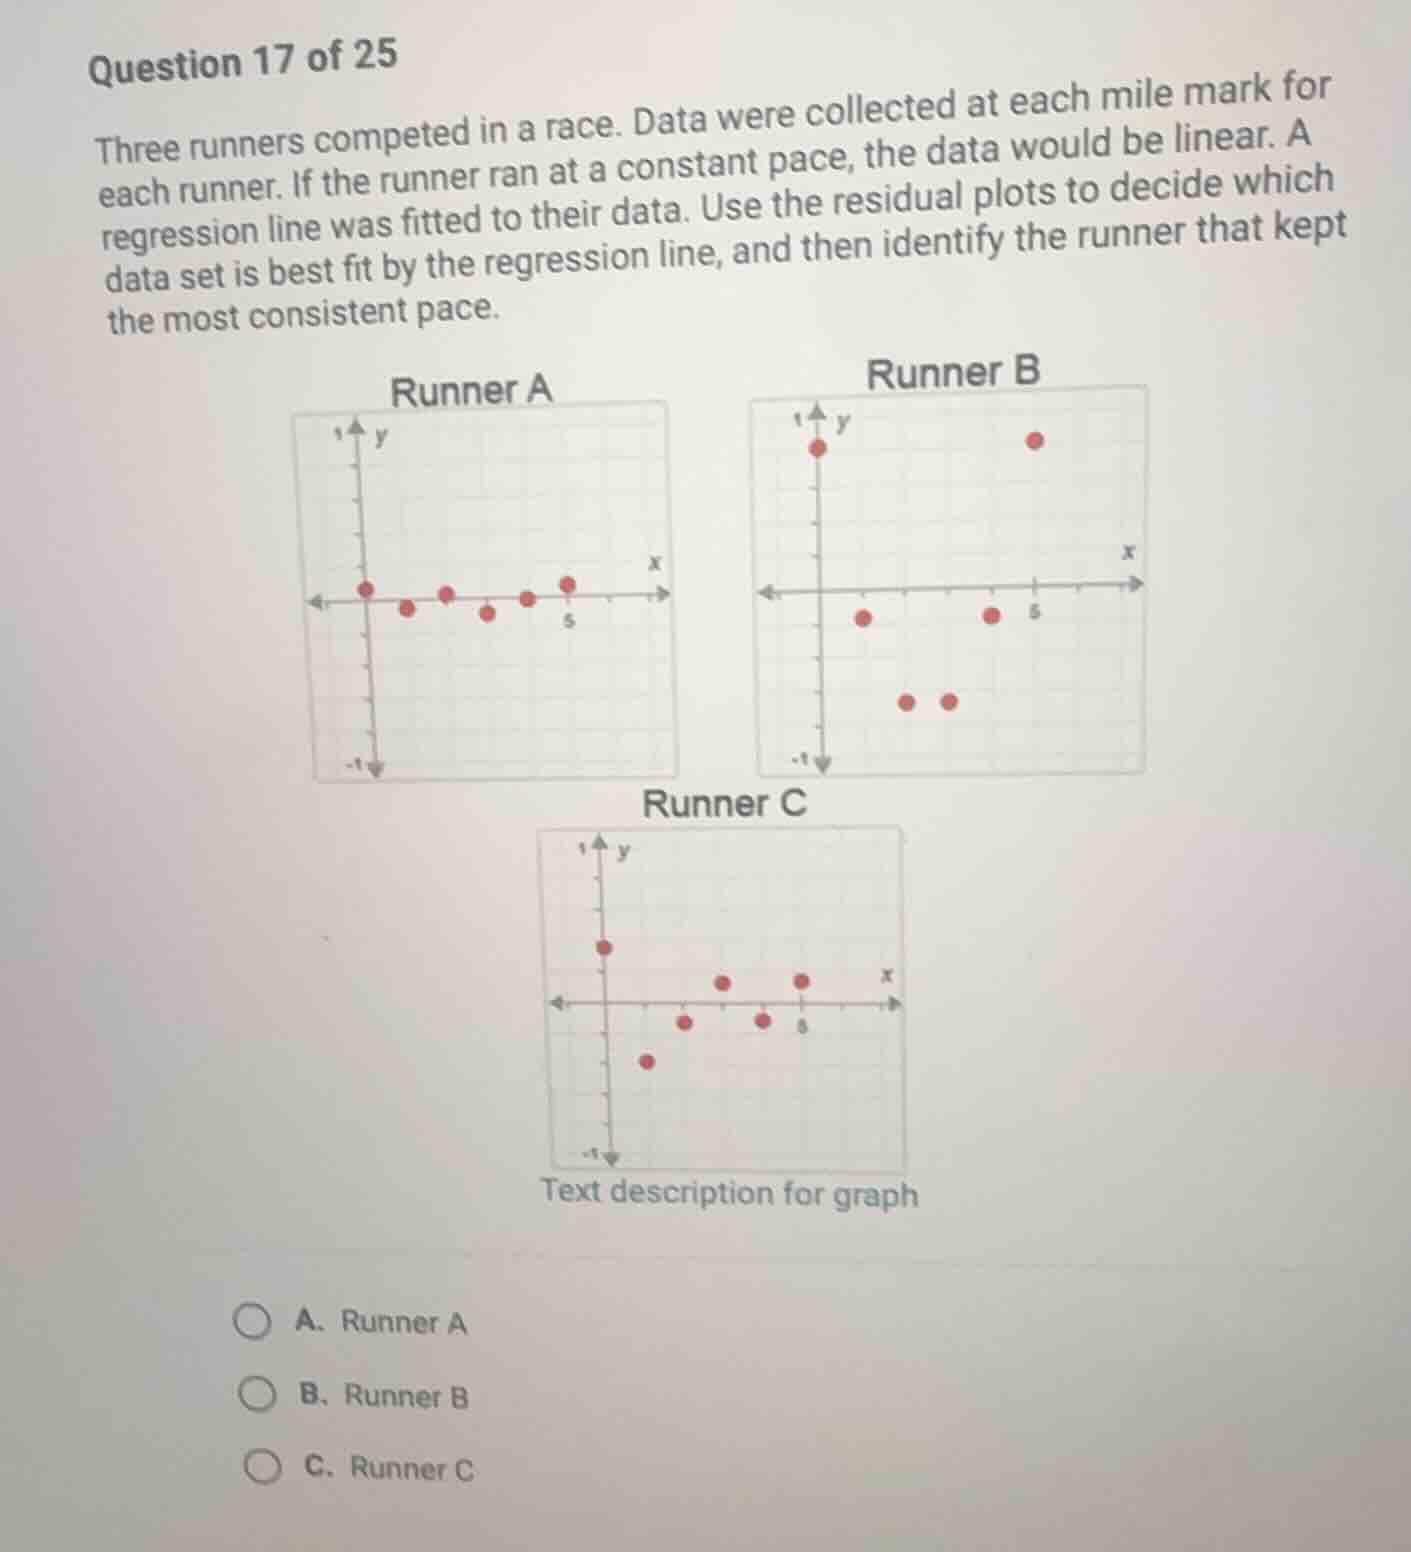
three runners competed in a race. data were collected at each mile mark for each runner. if the runner ran at a constant pace, the data would be linear. a regression line was fitted to their data. use the residual plots to decide which data set is best fit by the regression line, and then identify the runner that kept the most consistent pace.
a. runner a
b. runner b
c. runner c
Understand residual plot meaning
Residual plots show the difference between observed values and predicted values. Smaller residuals mean data points are closer to the Linear Regression Line.
Analyze Runner A's plot
Using the Linear Regression Line concept, we examine Runner A's residuals. The points are clustered very close to the horizontal axis \(y = 0\), indicating very small prediction errors.
Analyze Runner B's plot
Runner B's residuals are highly spread out, with values ranging from approximately \(-0.6\) to \(0.8\). This indicates large deviations from the regression line.
Analyze Runner C's plot
Runner C's residuals show a distinct U-shaped curved pattern. A curved pattern indicates that a linear model is not the best fit for the data.
Determine the best fit
Runner A has the smallest residuals and no distinct non-linear pattern. Thus, Runner A kept the most consistent pace and is best fit by the regression line.

Snap & solve any problem in the app
Get step-by-step solutions on Sovi AI
Photo-based solutions with guided steps
Explore more problems and detailed explanations
- A. Runner A (Correct answer)
- B. Runner B
- C. Runner C