QUESTION IMAGE
Question
problem 1
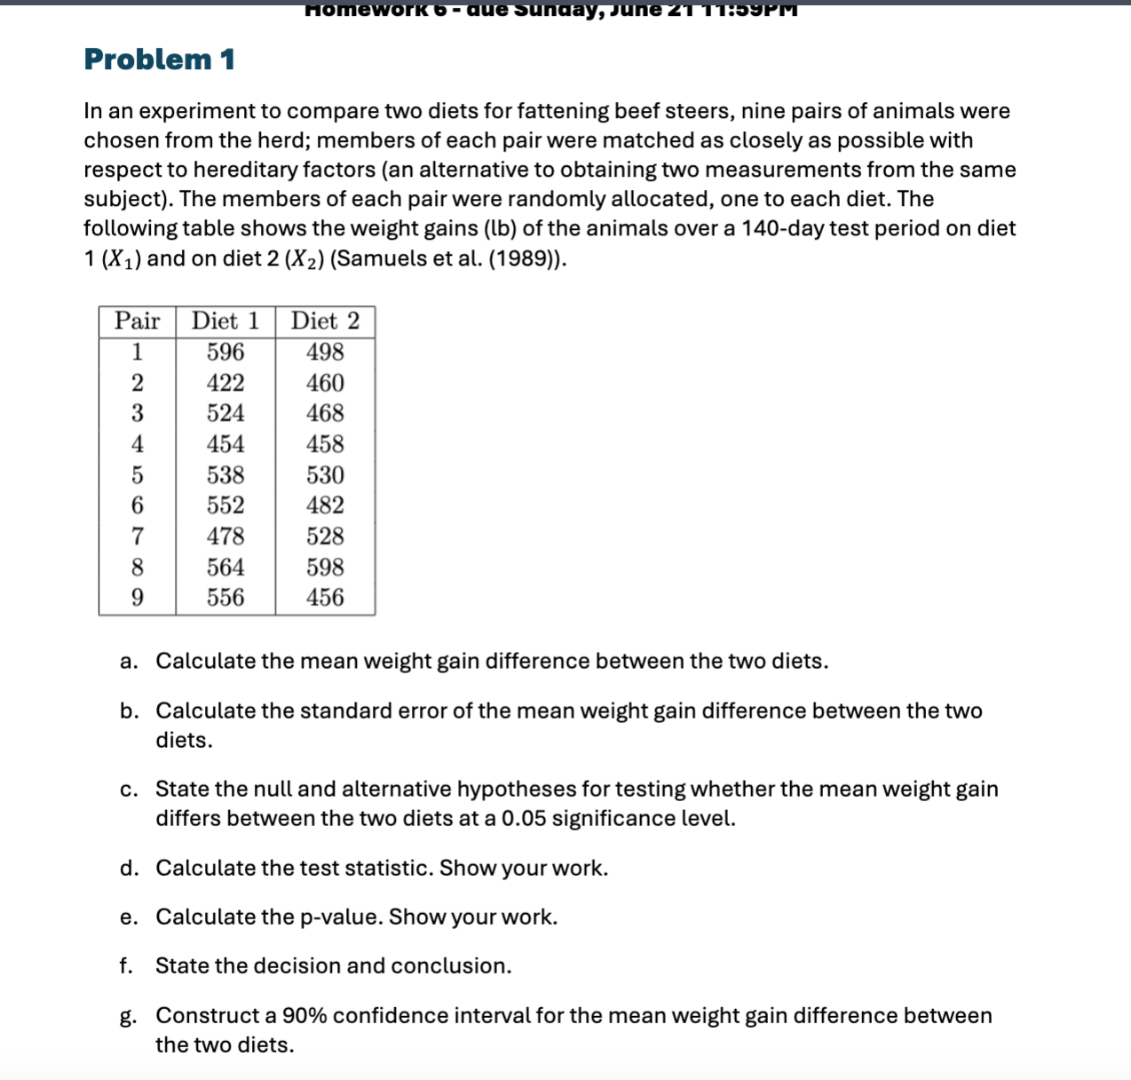
in an experiment to compare two diets for fattening beef steers, nine pairs of animals were chosen from the herd; members of each pair were matched as closely as possible with respect to hereditary factors (an alternative to obtaining two measurements from the same subject). the members of each pair were randomly allocated, one to each diet. the following table shows the weight gains (lb) of the animals over a 140-day test period on diet 1 (\\(x_1\\)) and on diet 2 (\\(x_2\\)) (samuels et al. (1989)).
a. calculate the mean weight gain difference between the two diets.
b. calculate the standard error of the mean weight gain difference between the two diets.
c. state the null and alternative hypotheses for testing whether the mean weight gain differs between the two diets at a 0.05 significance level.
d. calculate the test statistic. show your work.
e. calculate the p-value. show your work.
f. state the decision and conclusion.
g. construct a 90% confidence interval for the mean weight gain difference between the two diets.
🆕 New Concept Discovered: Paired t-Test
Comparing matched pairs to find differences.
Step 1: Calculate the differences for each pair
Let the difference for each pair be \( d_i = X_{1i} - X_{2i} \).
- Pair 1: \( 596 - 498 = 98 \)
- Pair 2: \( 422 - 460 = -38 \)
- Pair 3: \( 524 - 468 = 56 \)
- Pair 4: \( 454 - 458 = -4 \)
- Pair 5: \( 538 - 530 = 8 \)
- Pair 6: \( 552 - 482 = 70 \)
- Pair 7: \( 478 - 528 = -50 \)
- Pair 8: \( 564 - 598 = -34 \)
- Pair 9: \( 556 - 456 = 100 \)
The set of differences is: \( \{98, -38, 56, -4, 8, 70, -50, -34, 100\} \).
The sample size is \( n = 9 \).
The mean difference \( \bar{d} \) is:
Step 2: Calculate the standard error of the mean difference
First, calculate the sample variance of the differences \( s_d^2 \):
Let's calculate the squared deviations from the mean \( \bar{d} \approx 22.89 \):
- \( (98 - 22.89)^2 = 5641.51 \)
- \( (-38 - 22.89)^2 = 3707.60 \)
- \( (56 - 22.89)^2 = 1096.27 \)
- \( (-4 - 22.89)^2 = 723.07 \)
- \( (8 - 22.89)^2 = 221.71 \)
- \( (70 - 22.89)^2 = 2219.35 \)
- \( (-50 - 22.89)^2 = 5312.95 \)
- \( (-34 - 22.89)^2 = 3236.47 \)
- \( (100 - 22.89)^2 = 5945.95 \)
Sum of squared deviations:
Sample variance \( s_d^2 \):
Sample standard deviation \( s_d \):
Standard error of the mean difference \( SE_{\bar{d}} \):
Step 3: State the hypotheses
We want to test if the mean weight gain differs between the two diets (a two-tailed test). Let \( \mu_d \) be the true mean difference in weight gain between Diet 1 and Diet 2.
- Null Hypothesis: \( H_0: \mu_d = 0 \)
- Alternative Hypothesis: \( H_a: \mu_d
eq 0 \)
Significance level: \( \alpha = 0.05 \)
Step 4: Calculate the test statistic
The test statistic \( t \) is calculated as:
Step 5: Calculate the p-value
The degrees of freedom are:
Using a \( t \)-distribution table or calculator for a two-tailed test with \( t = 1.1585 \) and \( df = 8 \):
Step 6: State the decision and conclusion
Since the \( p\text{-value} \approx 0.2804 \) is greater than the significance level \( \alpha = 0.05 \), we fail to reject the null hypothesis \( H_0 \).
Conclusion: There is not enough statistical evidence at the \( 0.05 \) significance level to conclude that the mean weight gain differs between the two diets.
Step 7: Construct a 90% confidence interval
For a \( 90\% \) confidence level and \( df = 8 \), the critical value \( t_{\alpha/2} \) is:
The margin of error \( ME \) is:
The confidence interval is:

Snap & solve any problem in the app
Get step-by-step solutions on Sovi AI
Photo-based solutions with guided steps
Explore more problems and detailed explanations
a. Mean weight gain difference:
b. Standard error of the mean difference:
c. Hypotheses:
- \( H_0: \mu_d = 0 \)
- \( H_a: \mu_d
eq 0 \)
d. Test statistic:
e. p-value:
f. Decision and conclusion:
- Decision: Fail to reject \( H_0 \) because \( p\text{-value} > 0.05 \).
- Conclusion: There is no significant difference in the mean weight gain between the two diets.
g. 90% Confidence Interval: