QUESTION IMAGE
Question
practice graphing exponential functions in base e.
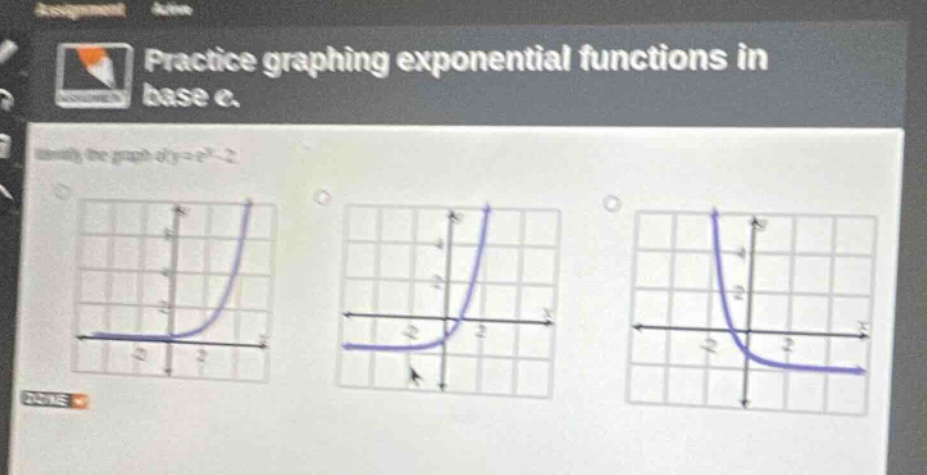
identify the graph of (y = e^x - 2).
⚡ Using what you learned: combining transformations
Step 1: Identify the horizontal asymptote
The parent function is \( y = e^x \), which has a horizontal asymptote at \( y = 0 \).
Subtracting \( 2 \) shifts the entire graph down by \( 2 \) units:
This shifts the horizontal asymptote to:
Looking at the options:
- The first graph has a horizontal asymptote at \( y = 0 \).
- The second graph has a horizontal asymptote at \( y = -2 \).
- The third graph has a horizontal asymptote at \( y = -2 \).
Step 2: Find the y-intercept
To find where the graph crosses the y-axis, substitute \( x = 0 \) into the equation:
The y-intercept is at \( (0, -1) \).
Looking at the remaining options with asymptote \( y = -2 \):
- The second graph passes through \( (0, -1) \) and curves upwards from left to right (exponential growth).
- The third graph shows exponential decay.
Therefore, the second graph is the correct representation.

Snap & solve any problem in the app
Get step-by-step solutions on Sovi AI
Photo-based solutions with guided steps
Explore more problems and detailed explanations
The correct graph is the second option (the middle graph), which has a horizontal asymptote at \( y = -2 \) and a y-intercept at \( (0, -1) \).