QUESTION IMAGE
Question
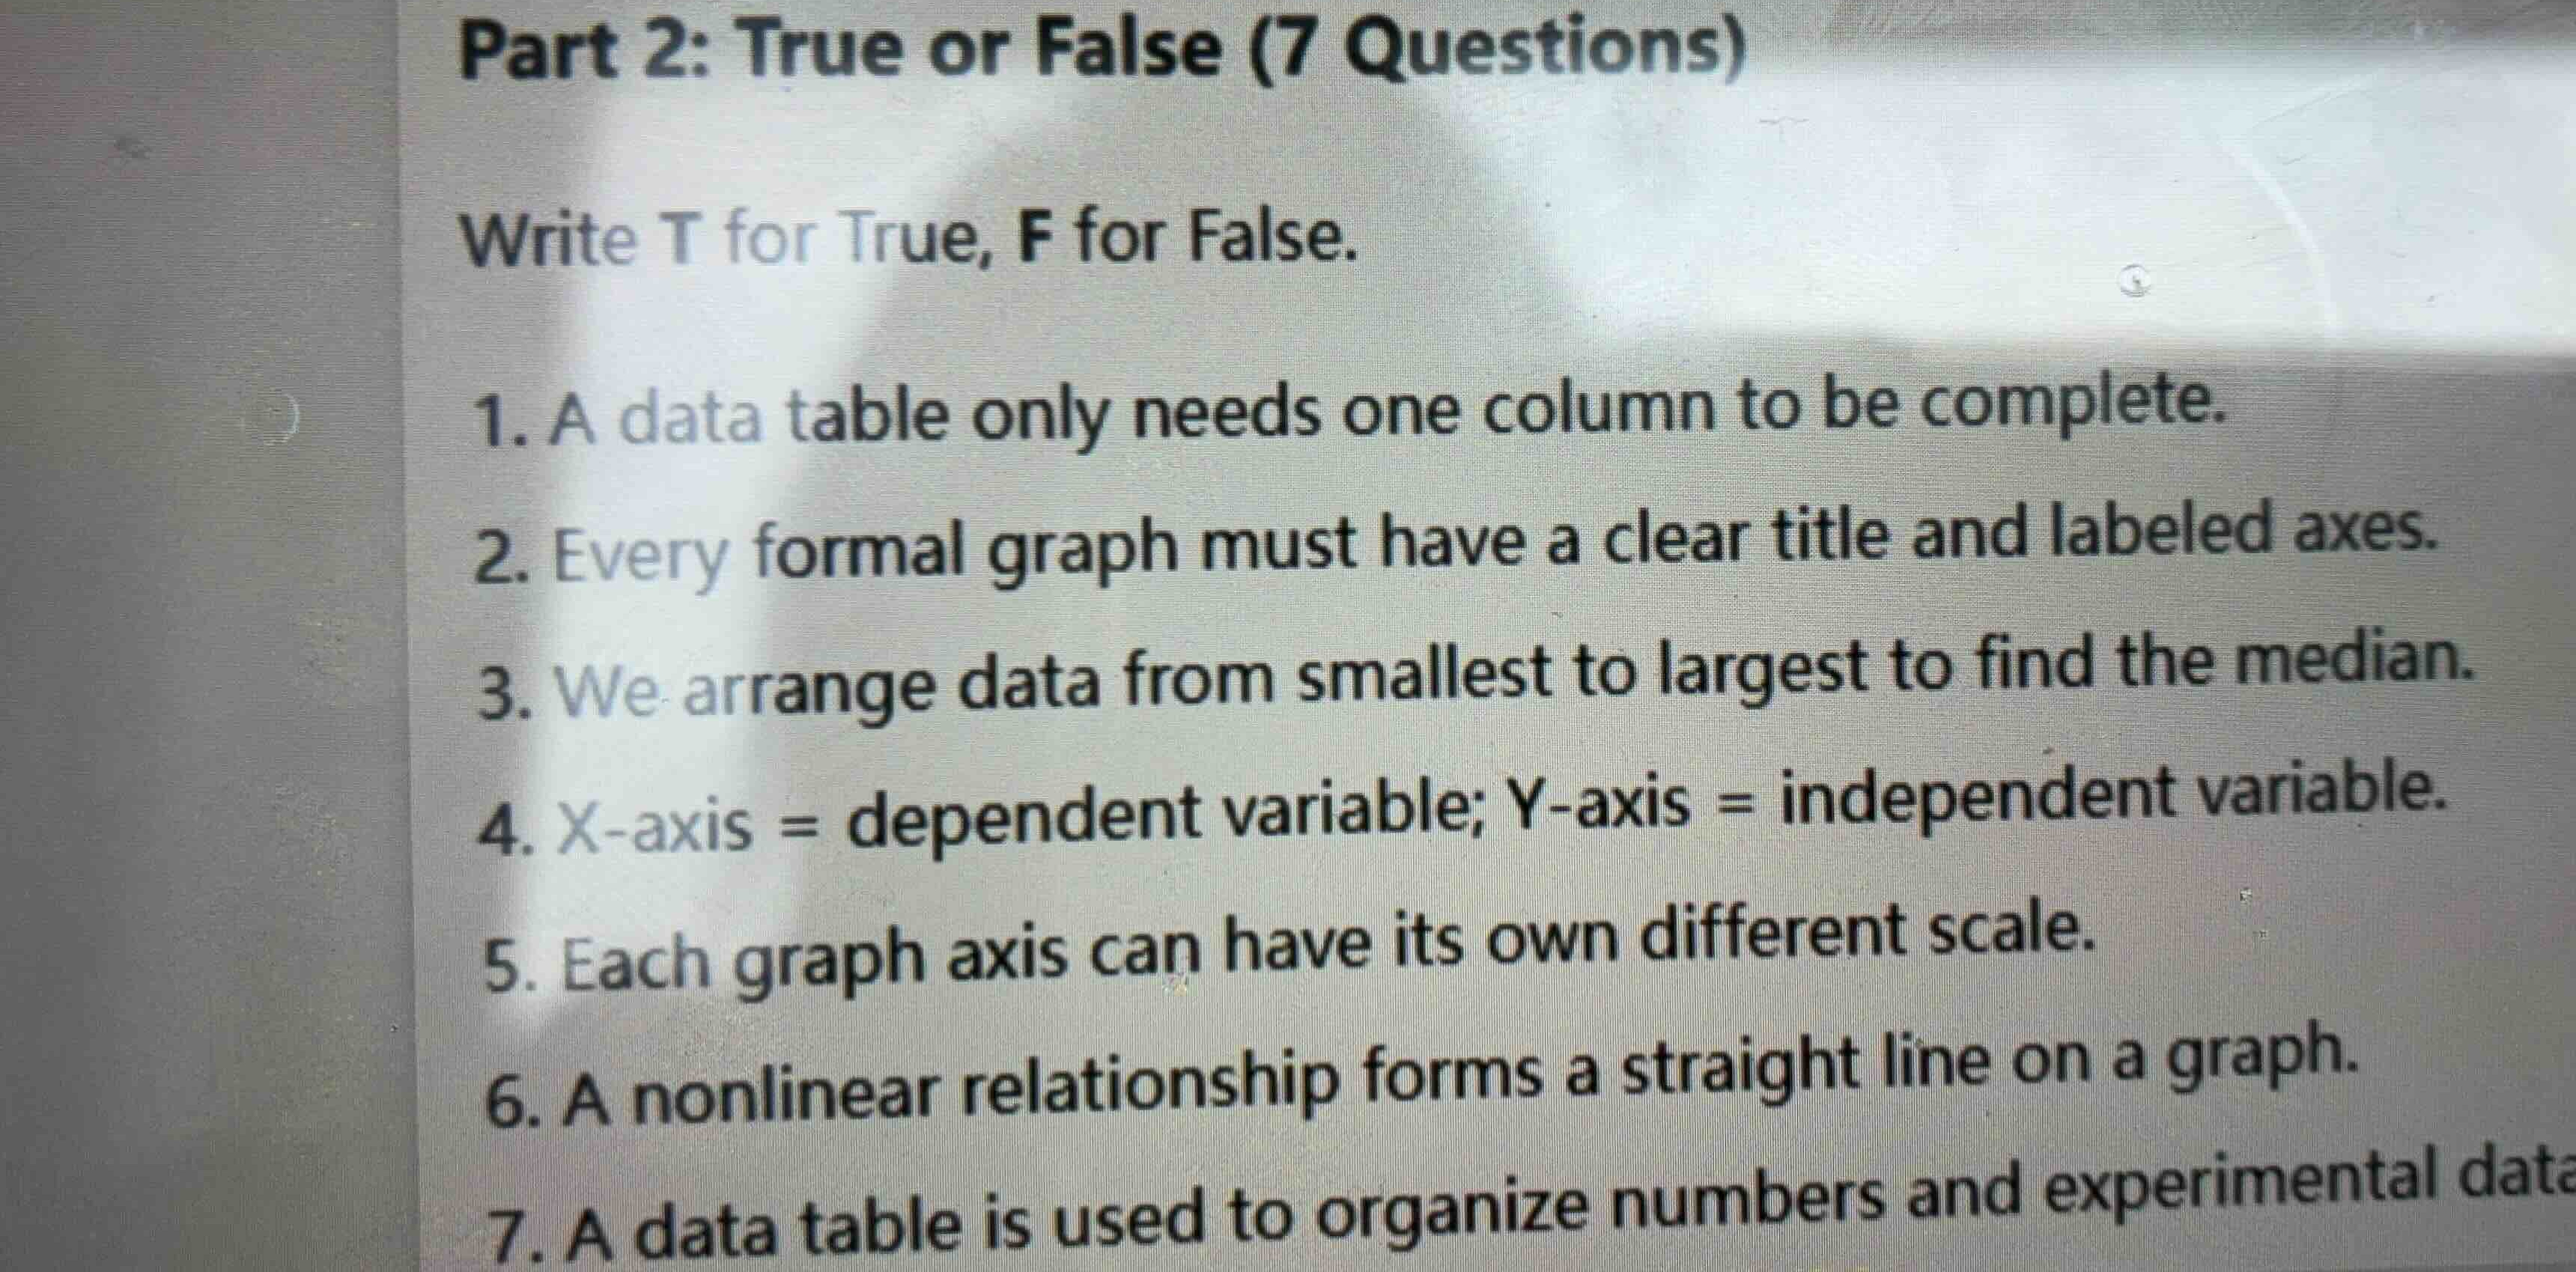
part 2: true or false (7 questions)
write t for true, f for false.
- a data table only needs one column to be complete.
- every formal graph must have a clear title and labeled axes.
- we arrange data from smallest to largest to find the median.
- x-axis = dependent variable; y-axis = independent variable.
- each graph axis can have its own different scale.
- a nonlinear relationship forms a straight line on a graph.
- a data table is used to organize numbers and experimental data.
Analyze data table columns
Using the Data Tables knowledge point.
A complete data table needs at least two columns to show relationships.
Therefore, statement 1 is false.
Analyze graph requirements
Using the Graphing Data knowledge point.
Every formal graph requires a clear title and labeled axes.
Therefore, statement 2 is true.
Analyze median calculation
Using the Measures of Center knowledge point.
Finding the median requires ordering data from smallest to largest.
Therefore, statement 3 is true.
Analyze graph axes variables
Using the Scientific Variables and Graphing Data knowledge points.
The x-axis represents the independent variable, and the y-axis represents the dependent variable.
Therefore, statement 4 is false.
Analyze graph axis scales
Using the Graphing Data knowledge point.
Each axis on a graph can have its own distinct scale.
Therefore, statement 5 is true.
Analyze nonlinear relationships
A nonlinear relationship forms a curved line, not a straight line.
Therefore, statement 6 is false.
Analyze data table purpose
Using the Data Tables knowledge point.
Data tables are designed to organize numbers and experimental data.
Therefore, statement 7 is true.

Snap & solve any problem in the app
Get step-by-step solutions on Sovi AI
Photo-based solutions with guided steps
Explore more problems and detailed explanations
| No. | Answer |
|---|---|
| 2 | T |
| 3 | T |
| 4 | F |
| 5 | T |
| 6 | F |
| 7 | T |