QUESTION IMAGE
Question
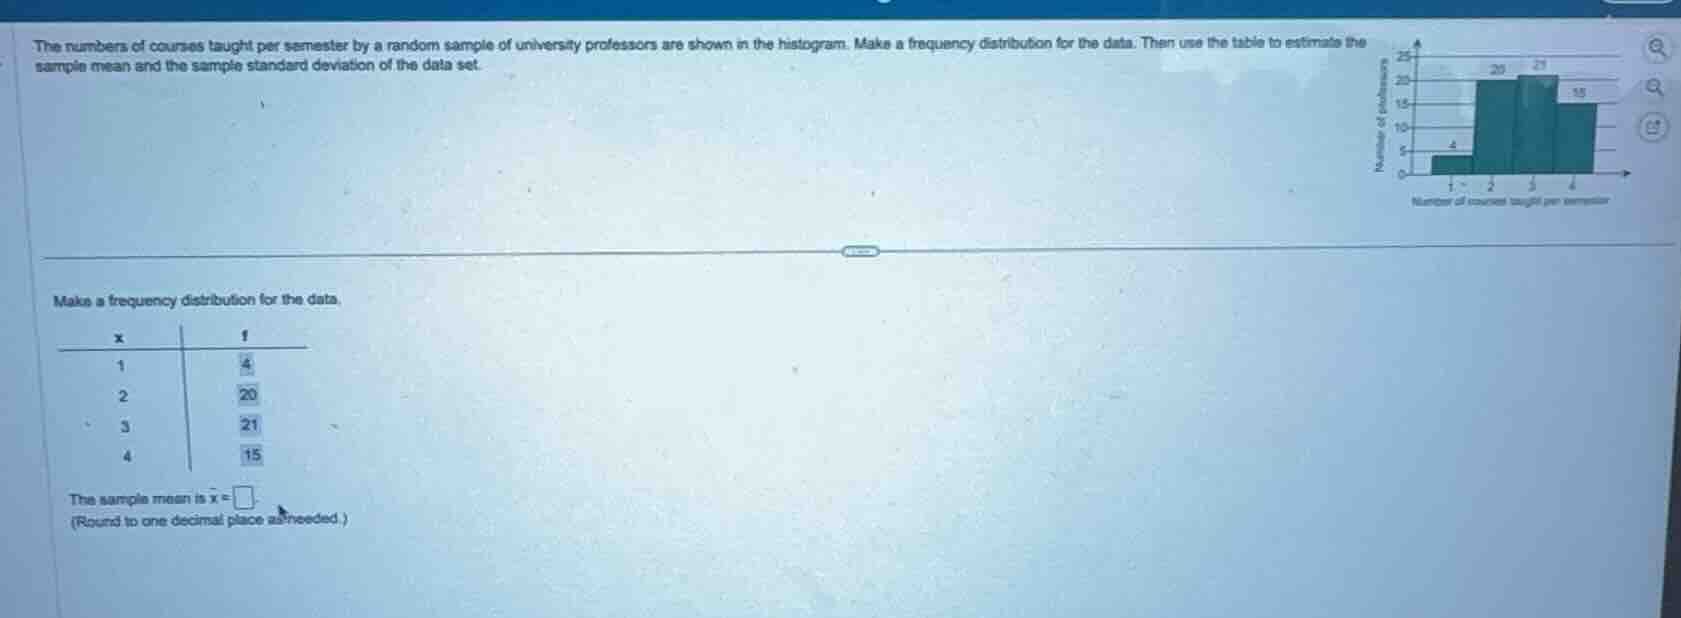
the numbers of courses taught per semester by a random sample of university professors are shown in the histogram. make a frequency distribution for the data. then use the table to estimate the sample mean and the sample standard deviation of the data set.
make a frequency distribution for the data.
\
the sample mean is \bar{x} = \box
(round to one decimal place as needed.)
Identify the given frequency distribution
Using the Frequency Distribution knowledge point
Calculate the sample size
Using the Frequency Distribution knowledge point
Calculate the sum of products
Using the Mean Calculation knowledge point
Calculate the sample mean
Using the Mean Calculation knowledge point
Rounding to one decimal place:

Snap & solve any problem in the app
Get step-by-step solutions on Sovi AI
Photo-based solutions with guided steps
Explore more problems and detailed explanations
The sample mean is \(\bar{x} =\) <blank>\(2.8\)</blank>