QUESTION IMAGE
Question
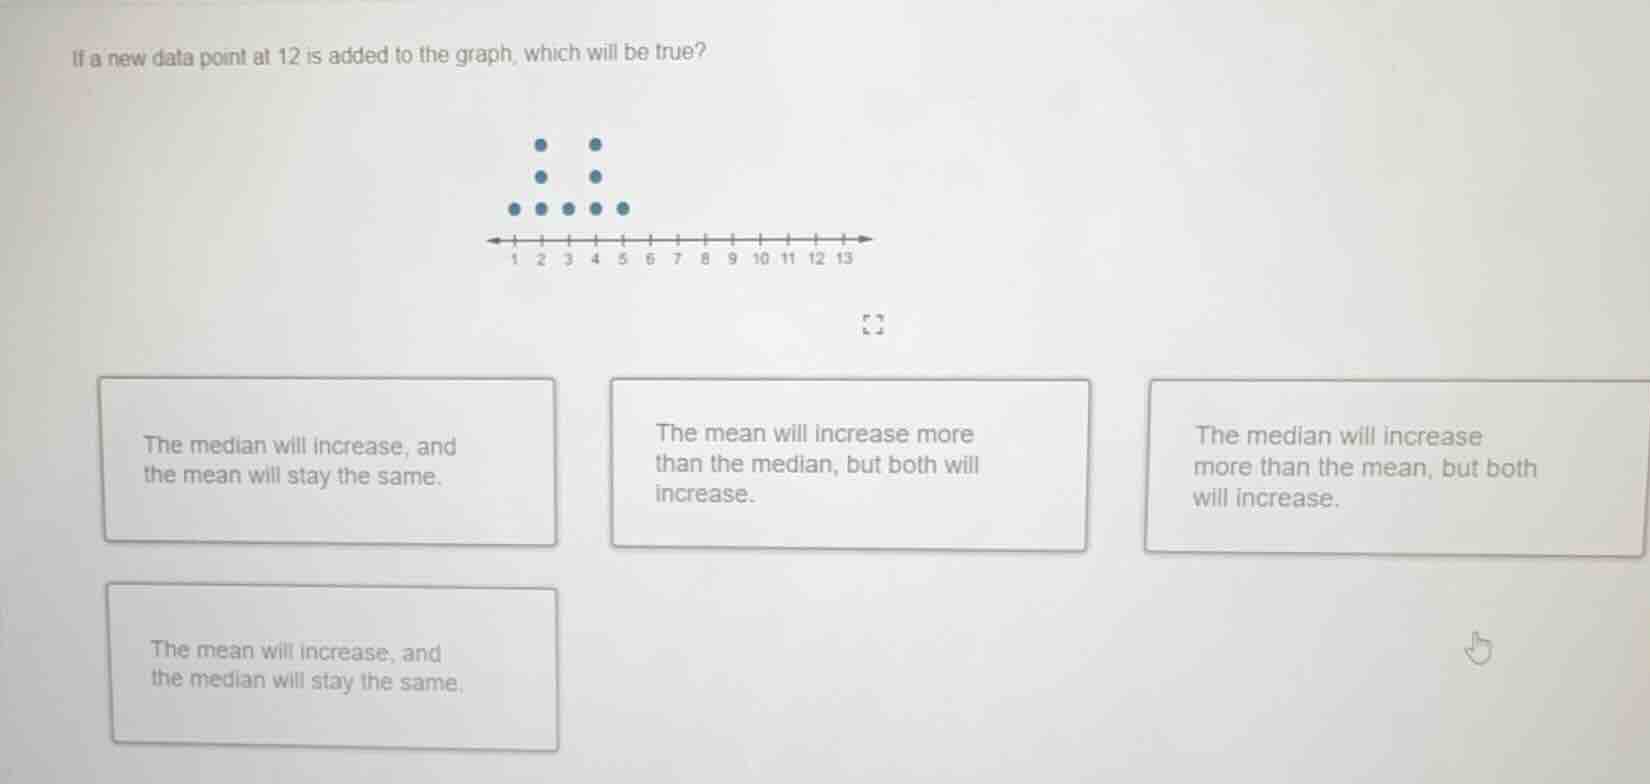
if a new data point at 12 is added to the graph, which will be true?
- the median will increase, and the mean will stay the same.
- the mean will increase more than the median, but both will increase.
- the median will increase more than the mean, but both will increase.
- the mean will increase, and the median will stay the same.
List the original data points
The dot plot shows the following data values:
- One dot at 1
- Three dots at 2
- One dot at 3
- Three dots at 4
- One dot at 5
The dataset is:
$$
\{1, 2, 2, 2, 3, 4, 4, 4, 5\}
$$
The number of data points is \(n = 9\).
Calculate initial mean and median
The sum of the data is:
$$
1 + 2\times3 + 3 + 4\times3 + 5 = 1 + 6 + 3 + 12 + 5 = 27
$$
The initial mean is:
$$
\mu_{\text{initial}} = \frac{27}{9} = 3
$$
Since \(n = 9\) is odd, the median is the 5th value in the ordered list:
$$
\text{Median}_{\text{initial}} = 3
$$
Calculate new mean and median with the outlier
Adding a new data point at 12, the new dataset is:
$$
\{1, 2, 2, 2, 3, 4, 4, 4, 5, 12\}
$$
The new number of data points is \(n = 10\).
The new sum is:
$$
27 + 12 = 39
$$
The new mean is:
$$
\mu_{\text{new}} = \frac{39}{10} = 3.9
$$
Since \(n = 10\) is even, the median is the average of the 5th and 6th values (3 and 4):
$$
\text{Median}_{\text{new}} = \frac{3 + 4}{2} = 3.5
$$
Compare the changes
- The mean increased from 3 to 3.9 (an increase of 0.9).
- The median increased from 3 to 3.5 (an increase of 0.5).
- Both measures increased, but the mean increased more than the median because 12 is an extreme outlier.

Snap & solve any problem in the app
Get step-by-step solutions on Sovi AI
Photo-based solutions with guided steps
Explore more problems and detailed explanations
- The median will increase, and the mean will stay the same.
- The mean will increase more than the median, but both will increase. (Correct answer)
- The median will increase more than the mean, but both will increase.
- The mean will increase, and the median will stay the same.