QUESTION IMAGE
Question
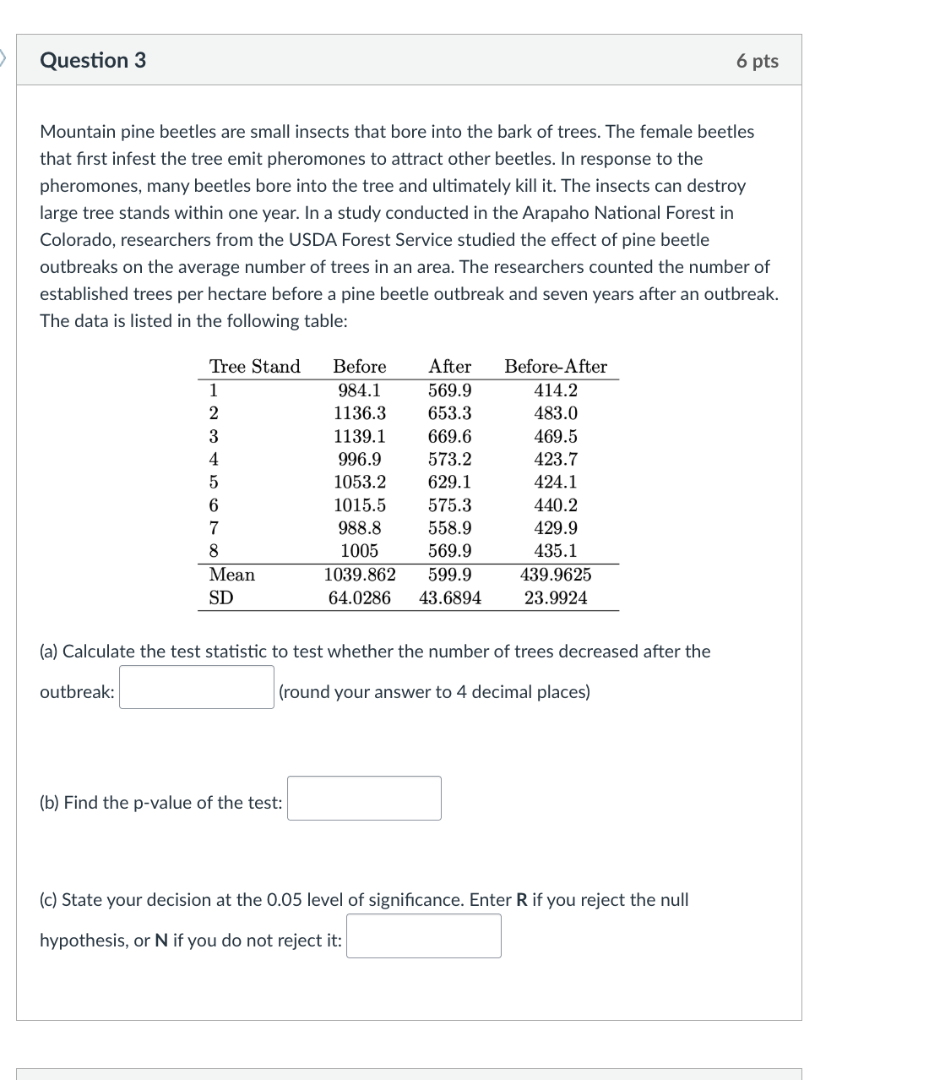
mountain pine beetles are small insects that bore into the bark of trees. the female beetles that first infest the tree emit pheromones to attract other beetles. in response to the pheromones, many beetles bore into the tree and ultimately kill it. the insects can destroy large tree stands within one year. in a study conducted in the arapaho national forest in colorado, researchers from the usda forest service studied the effect of pine beetle outbreaks on the average number of trees in an area. the researchers counted the number of established trees per hectare before a pine beetle outbreak and seven years after an outbreak. the data is listed in the following table:
\
(a) calculate the test statistic to test whether the number of trees decreased after the outbreak: (round your answer to 4 decimal places)
(b) find the p-value of the test:
(c) state your decision at the 0.05 level of significance. enter r if you reject the null hypothesis, or n if you do not reject it:
⚡ Using what you learned: Hypothesis Testing
Step 1: Identify the Test Type and Parameters
We are testing whether the number of trees decreased after the outbreak using paired data (Before and After measurements on the same 8 tree stands).
Let \( d = \text{Before} - \text{After} \).
If the number of trees decreased after the outbreak, then "Before" should be greater than "After", meaning the differences \( d \) should be positive on average.
The hypotheses are:
- Null hypothesis: \( H_0: \mu_d = 0 \)
- Alternative hypothesis: \( H_a: \mu_d > 0 \)
From the table, the summary statistics for the differences \( d = \text{Before} - \text{After} \) are:
- Sample size: \( n = 8 \)
- Mean difference: \( \bar{d} = 439.9625 \)
- Standard deviation of differences: \( s_d = 23.9924 \)
- Degrees of freedom: \( \text{df} = n - 1 = 7 \)
Step 2: Calculate the Test Statistic
The paired \( t \)-test statistic is calculated as:
Substitute the values:
Rounding to 4 decimal places:
Step 3: Find the p-value
Using a \( t \)-distribution with \( \text{df} = 7 \) for a one-tailed test where \( t = 51.8665 \):
Since this \( t \)-value is extremely large, the probability of obtaining a value this extreme under the null hypothesis is virtually zero.
Step 4: State the Decision
Compare the \( p \)-value to the significance level \( \alpha = 0.05 \):
Since the \( p \)-value is less than \( \alpha \), we reject the null hypothesis.

Snap & solve any problem in the app
Get step-by-step solutions on Sovi AI
Photo-based solutions with guided steps
Explore more problems and detailed explanations
(a) 51.8665
(b) 0.0000 (or 0)
(c) R