QUESTION IMAGE
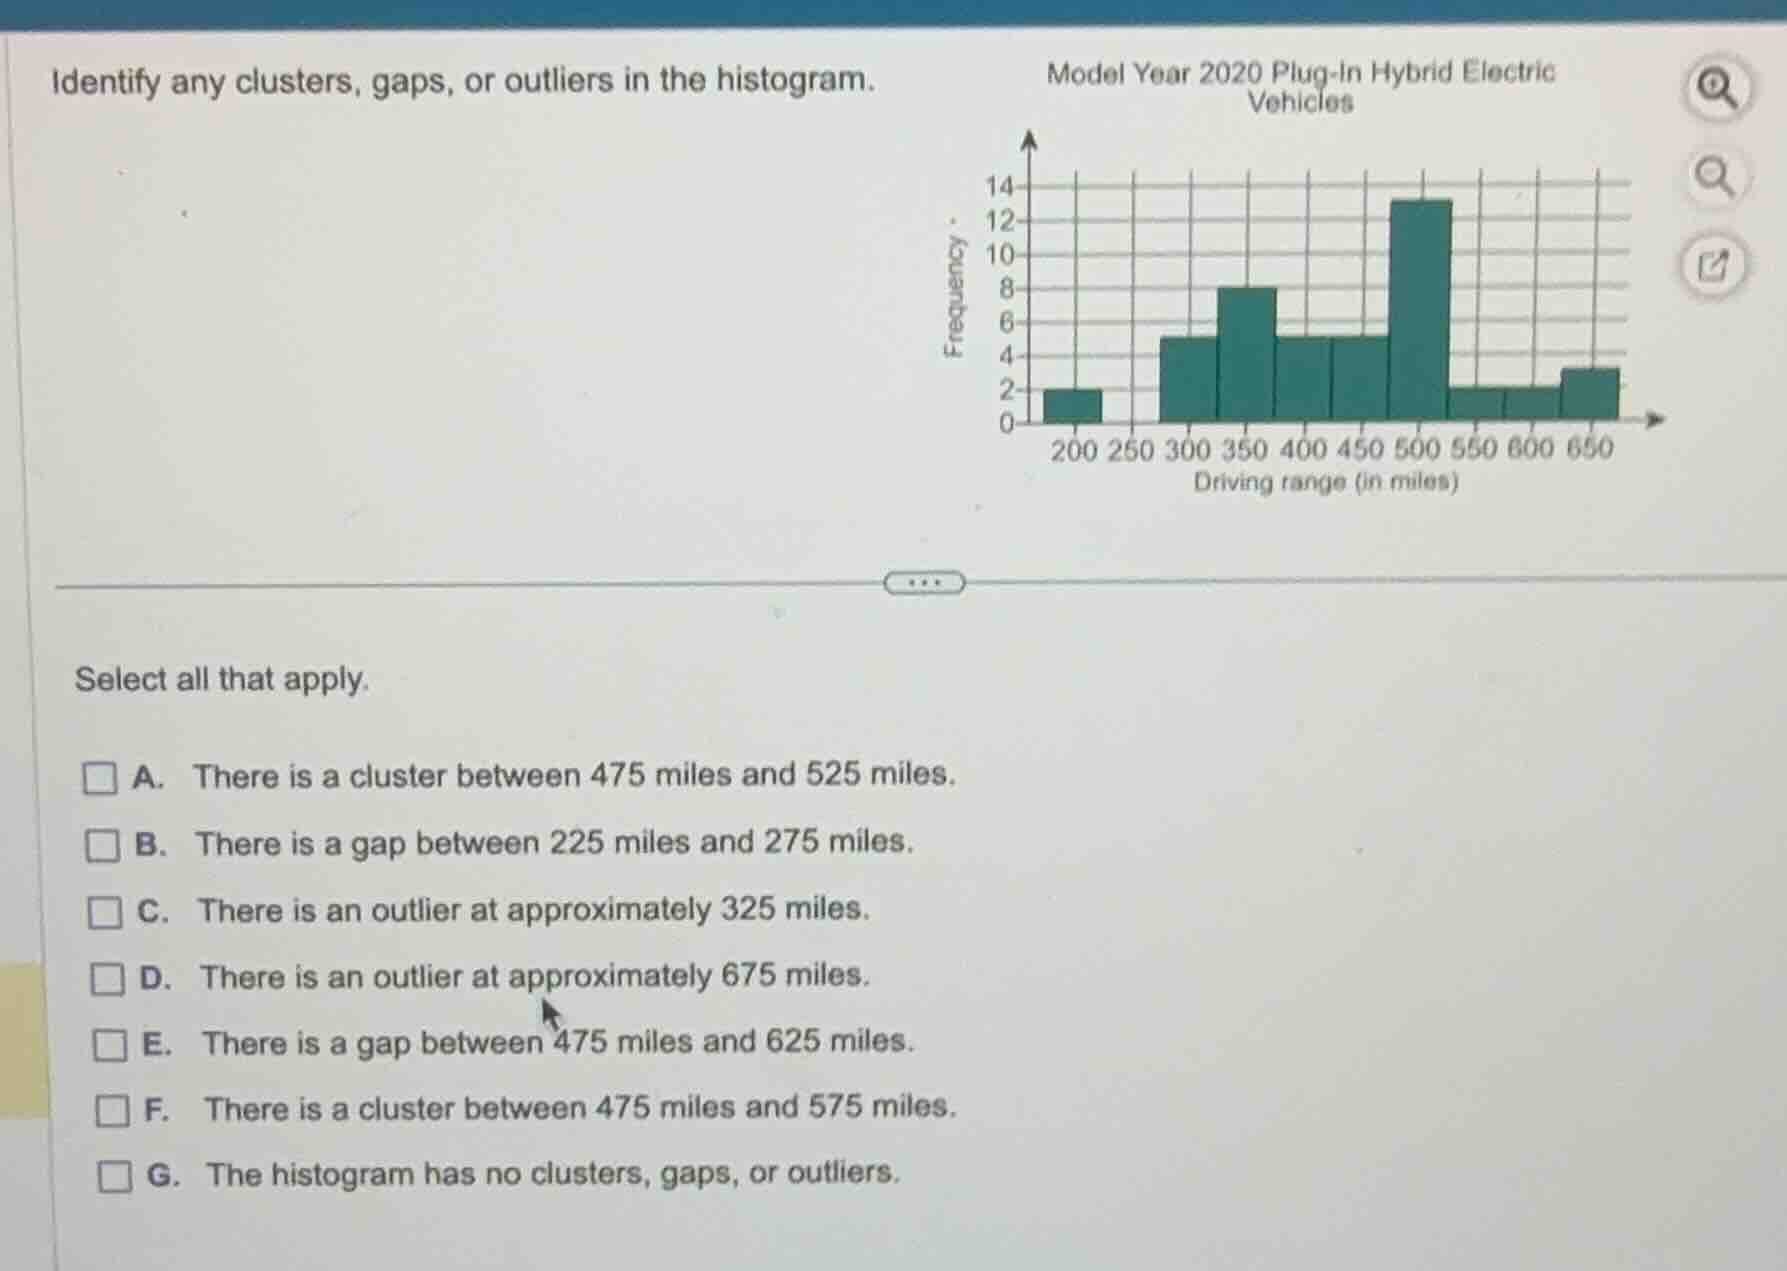
Question
identify any clusters, gaps, or outliers in the histogram.
select all that apply.
a. there is a cluster between 475 miles and 525 miles.
b. there is a gap between 225 miles and 275 miles.
c. there is an outlier at approximately 325 miles.
d. there is an outlier at approximately 675 miles.
e. there is a gap between 475 miles and 625 miles.
f. there is a cluster between 475 miles and 575 miles.
g. the histogram has no clusters, gaps, or outliers.
Analyze the histogram for gaps
$$
\text{Frequency for interval } [225, 275] = 0
$$
$$
\text{This indicates a gap between 225 miles and 275 miles.}
$$
Analyze the histogram for clusters
$$
\text{Peak frequency occurs in the interval } [475, 525] \text{ with a value of 13.}
$$
$$
\text{This represents a distinct cluster of data between 475 miles and 525 miles.}
$$
Analyze the histogram for outliers
$$
\text{The value at approximately 200 miles is separated from the rest of the data by a gap, but is not far enough to be a clear outlier.}
$$
$$
\text{There are no data points near 675 miles or isolated values at 325 miles.}
$$

Snap & solve any problem in the app
Get step-by-step solutions on Sovi AI
Photo-based solutions with guided steps
Explore more problems and detailed explanations
- A. There is a cluster between 475 miles and 525 miles. (Correct answer)
- B. There is a gap between 225 miles and 275 miles. (Correct answer)
- C. There is an outlier at approximately 325 miles.
- D. There is an outlier at approximately 675 miles.
- E. There is a gap between 475 miles and 625 miles.
- F. There is a cluster between 475 miles and 575 miles.
- G. The histogram has no clusters, gaps, or outliers.