QUESTION IMAGE
Question
Question was provided via image upload.
Identify boundary line properties
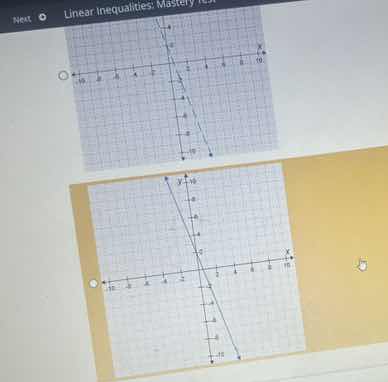
The visible graphs show a boundary line passing through specific grid intersections. Let's determine the equation of this boundary line.
Looking closely at the second graph (which is highlighted):
- The \(y\)-intercept is at \((0, 2)\).
- Another clear point on the line is \((1, -1)\) or \((2, -4)\).
- Let's calculate the slope \(m\):
$$
m = \frac{-1 - 2}{1 - 0} = -3
$$
- Thus, the equation of the boundary line is:
$$
y = -3x + 2
$$
Analyze inequality representations
In linear inequality graphing:
- A dashed boundary line represents a strict inequality (\(<\) or \(>\)).
- A solid boundary line represents a non-strict inequality (\(\le\) or \(\ge\)).
- The top graph shows a dashed boundary line:
$$
y < -3x + 2 \quad \text{or} \quad y > -3x + 2
$$
- The bottom graph shows a solid boundary line:
$$
y \le -3x + 2 \quad \text{or} \quad y \ge -3x + 2
$$
Determine shaded regions
Let's analyze the shaded region for the selected bottom graph:
- The shaded region lies to the left/below the solid line.
- Let's test the origin \((0,0)\), which is in the shaded region:
$$
0 \le -3(0) + 2 \implies 0 \le 2 \quad (\text{True})
$$
- Therefore, the bottom graph represents the inequality:
$$
y \le -3x + 2
$$
- The top graph has a dashed line with the same shaded region, representing:
$$
y < -3x + 2
$$

Snap & solve any problem in the app
Get step-by-step solutions on Sovi AI
Photo-based solutions with guided steps
Explore more problems and detailed explanations
The highlighted bottom graph represents the linear inequality with a solid boundary line:
- The graph of \(y \le -3x + 2\) (solid boundary line with shading below/left) (Correct answer)
- The graph of \(y < -3x + 2\) (dashed boundary line with shading below/left)