QUESTION IMAGE
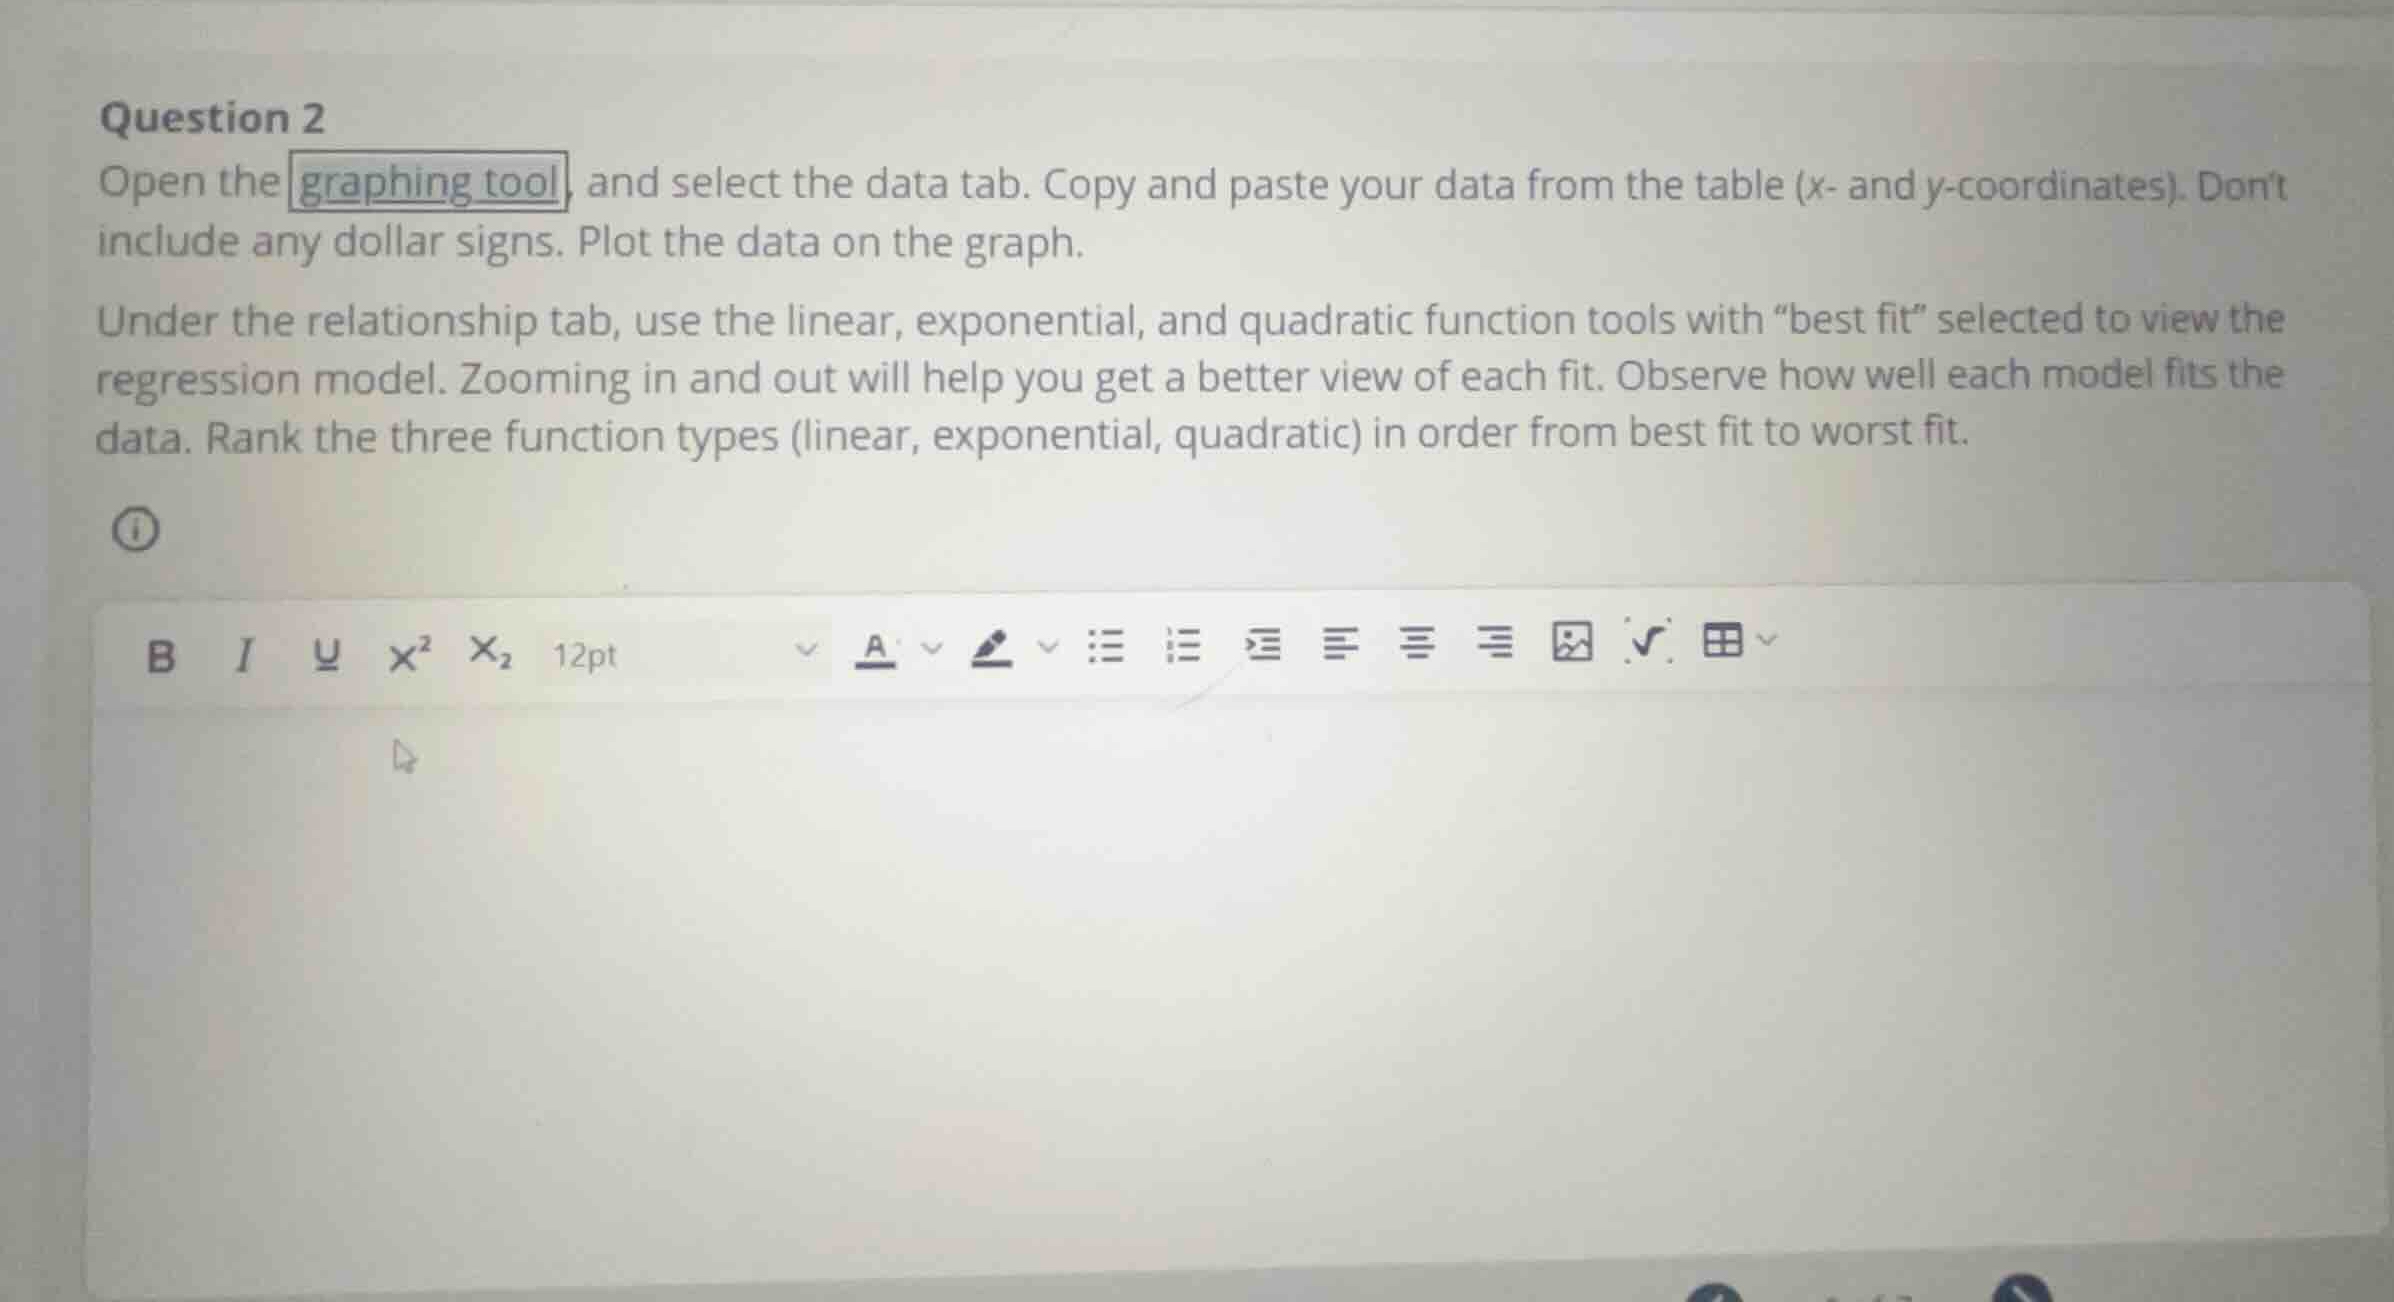
Question
Question was provided via image upload.
Identify the missing data
The prompt asks to copy and paste data from a table (containing \(x\)- and \(y\)-coordinates) into a graphing tool to perform linear, exponential, and quadratic regressions. However, the table containing the actual data points is not visible in the provided image.
Determine the required response
Since the specific numerical data is missing, we cannot perform the actual regression calculations or rank the fits for this specific dataset. We must explain how a student can perform this analysis once they have their data, and describe the general characteristics of how linear, exponential, and quadratic models fit different types of data trends.
Explain the evaluation process
To rank the three function types from best fit to worst fit:
- Plot the data: Look at the scatter plot of the coordinates.
- Apply the models: Use the graphing tool to overlay the "best fit" lines/curves for:
- Linear: \(y = mx + b\) (constant rate of change)
- Exponential: \(y = a \cdot b^x\) (proportional/percentage rate of change)
- Quadratic: \(y = ax^2 + bx + c\) (U-shaped curve, changing rate of change)
- Evaluate the fit: Observe which curve passes closest to all the data points. In many graphing tools, this is quantified by the coefficient of determination, \(R^2\). The model with the \(R^2\) value closest to \(1\) represents the best fit.

Snap & solve any problem in the app
Get step-by-step solutions on Sovi AI
Photo-based solutions with guided steps
Explore more problems and detailed explanations
Because the data table is not visible in the image, the exact ranking of the models cannot be calculated. To find the correct ranking for your specific dataset, follow these steps:
- Input your data into the graphing tool's data tab.
- Activate the regression models (linear, exponential, and quadratic) with the "best fit" option enabled.
- Compare the fits:
- Look at the visual alignment of each curve with your plotted points.
- Check the \(R^2\) (coefficient of determination) value for each model if provided by the tool. The model with the \(R^2\) value closest to \(1\) is the best fit, while the one furthest from \(1\) is the worst fit.
- Rank them in order from the one that tracks your data points most closely (best fit) to the one that misses them the most (worst fit).