QUESTION IMAGE
Question
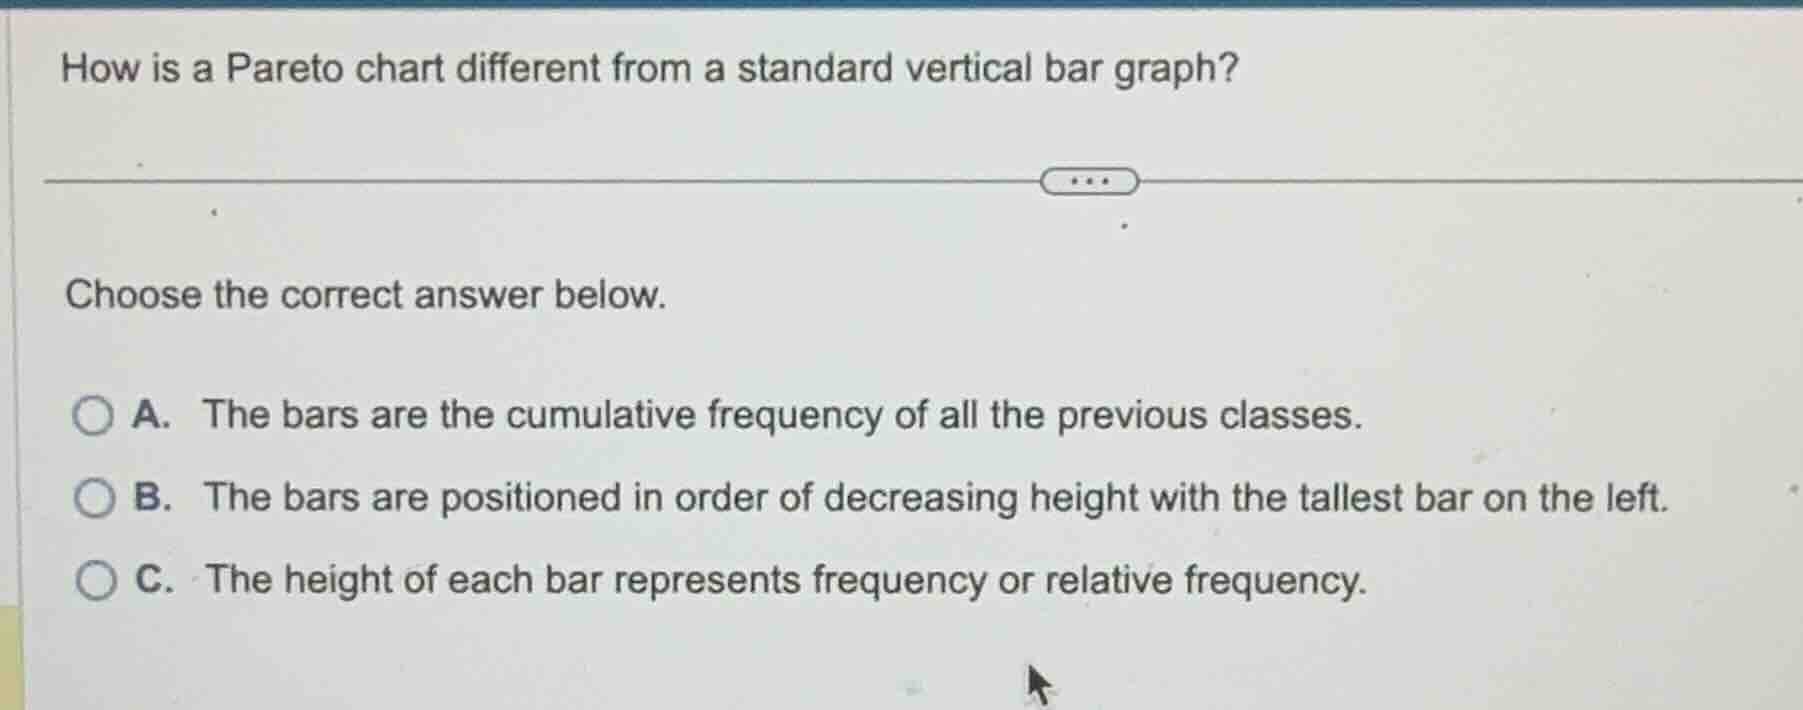
how is a pareto chart different from a standard vertical bar graph?
choose the correct answer below.
a. the bars are the cumulative frequency of all the previous classes.
b. the bars are positioned in order of decreasing height with the tallest bar on the left.
c. the height of each bar represents frequency or relative frequency.
Define a Pareto chart and its key characteristics
A Pareto chart is a specific type of vertical bar graph used to represent categorical data, where the bars are arranged in descending order of frequency or relative frequency.
Compare with a standard vertical bar graph
While a standard vertical bar graph can have its categories arranged in any order (such as alphabetical or chronological), a Pareto chart strictly orders the categories from highest frequency to lowest frequency, placing the tallest bar on the far left.
Evaluate the given options
- Option A is incorrect because the individual bars represent individual category frequencies, not cumulative frequencies.
- Option B is correct because it describes the defining ordering rule of a Pareto chart.
- Option C is incorrect because both standard bar graphs and Pareto charts use bar height to represent frequency or relative frequency, so this does not differentiate them.

Snap & solve any problem in the app
Get step-by-step solutions on Sovi AI
Photo-based solutions with guided steps
Explore more problems and detailed explanations
- (A) The bars are the cumulative frequency of all the previous classes.
- (B) The bars are positioned in order of decreasing height with the tallest bar on the left. (Correct answer)
- (C) The height of each bar represents frequency or relative frequency.