QUESTION IMAGE
Question
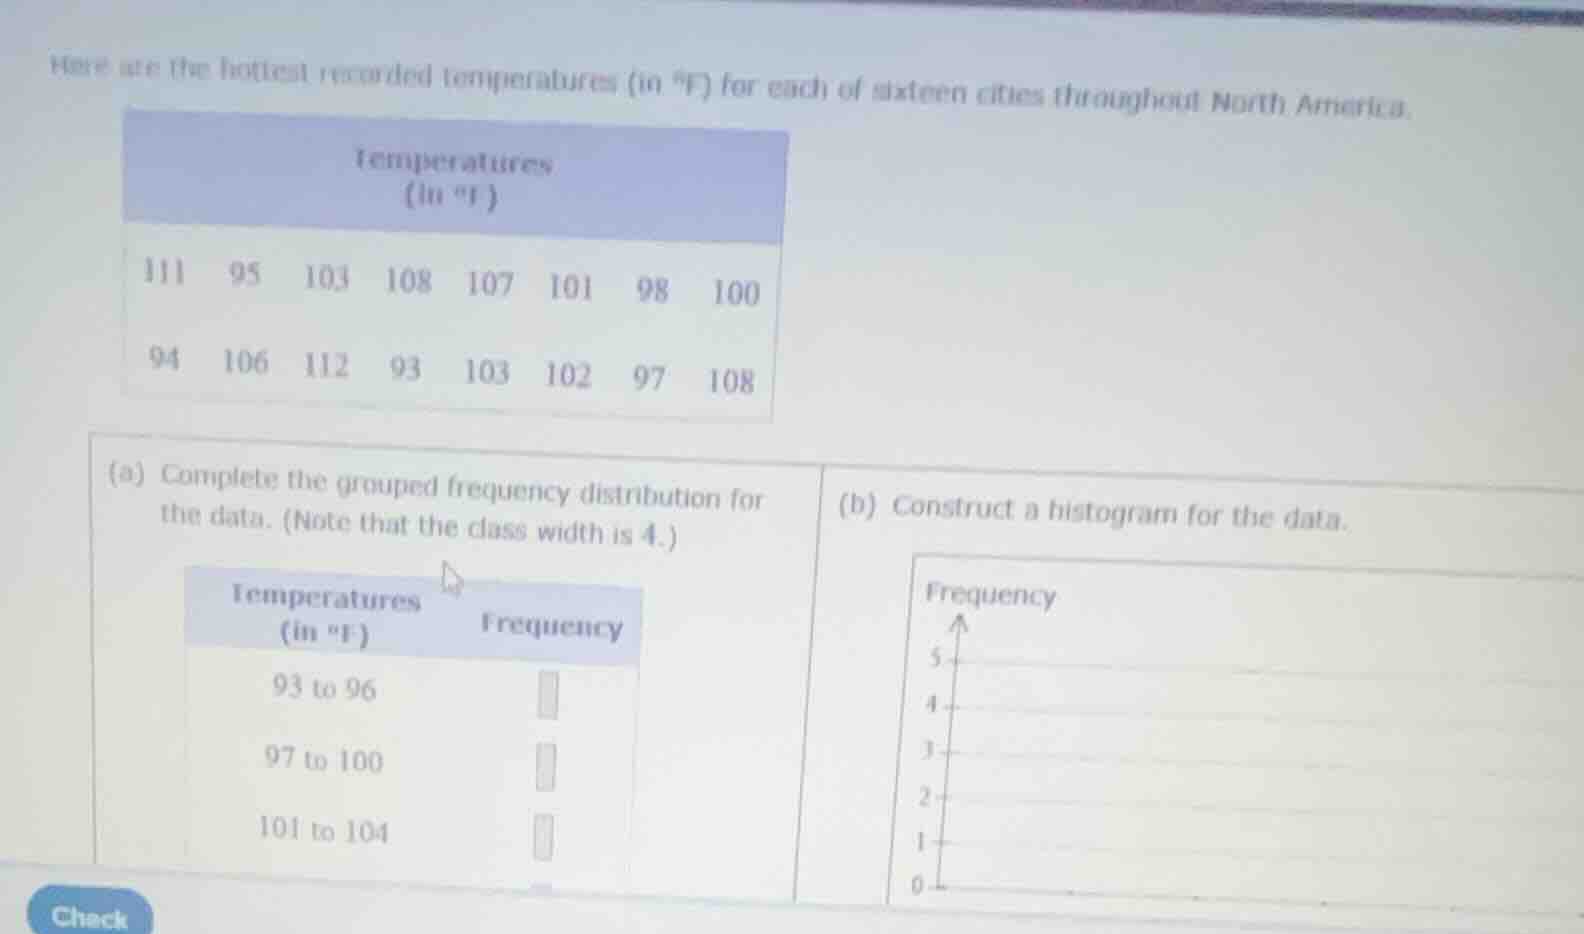
here are the hottest recorded temperatures (in \\(^{\circ}\text{f}\\)) for each of sixteen cities throughout north america.
temperatures (in \\(^{\circ}\text{f}\\))
111, 95, 103, 108, 107, 101, 98, 100
94, 106, 112, 93, 103, 102, 97, 108
(a) complete the grouped frequency distribution for the data. (note that the class width is 4.)
temperatures (in \\(^{\circ}\text{f}\\)) | frequency
93 to 96 |
97 to 100 |
101 to 104 |
(b) construct a histogram for the data.
Sort and tally the temperature data
The 16 temperature values are:
111, 95, 103, 108, 107, 101, 98, 100, 94, 106, 112, 93, 103, 102, 97, 108.
Sorting the data in ascending order:
93, 94, 95, 97, 98, 100, 101, 102, 103, 103, 106, 107, 108, 108, 111, 112.
Calculate frequencies for each class
Using a class width of 4:
- 93 to 96: 93, 94, 95 (3 values)
- 97 to 100: 97, 98, 100 (3 values)
- 101 to 104: 101, 102, 103, 103 (4 values)
- 105 to 108: 106, 107, 108, 108 (4 values)
- 109 to 112: 111, 112 (2 values)
Determine histogram boundaries
The classes and their corresponding frequencies are:
- 93 to 96: 3
- 97 to 100: 3
- 101 to 104: 4
- 105 to 108: 4
- 109 to 112: 2

Snap & solve any problem in the app
Get step-by-step solutions on Sovi AI
Photo-based solutions with guided steps
Explore more problems and detailed explanations
Question (a)
| Temperatures (in \(^\circ\text{F}\)) | Frequency |
|---|---|
| 97 to 100 | 3 |
| 101 to 104 | 4 |
| 105 to 108 | 4 |
| 109 to 112 | 2 |
Question (b)
The histogram is constructed with the following bar heights corresponding to each temperature interval:
- 93 to 96: height of 3
- 97 to 100: height of 3
- 101 to 104: height of 4
- 105 to 108: height of 4
- 109 to 112: height of 2