QUESTION IMAGE
Question
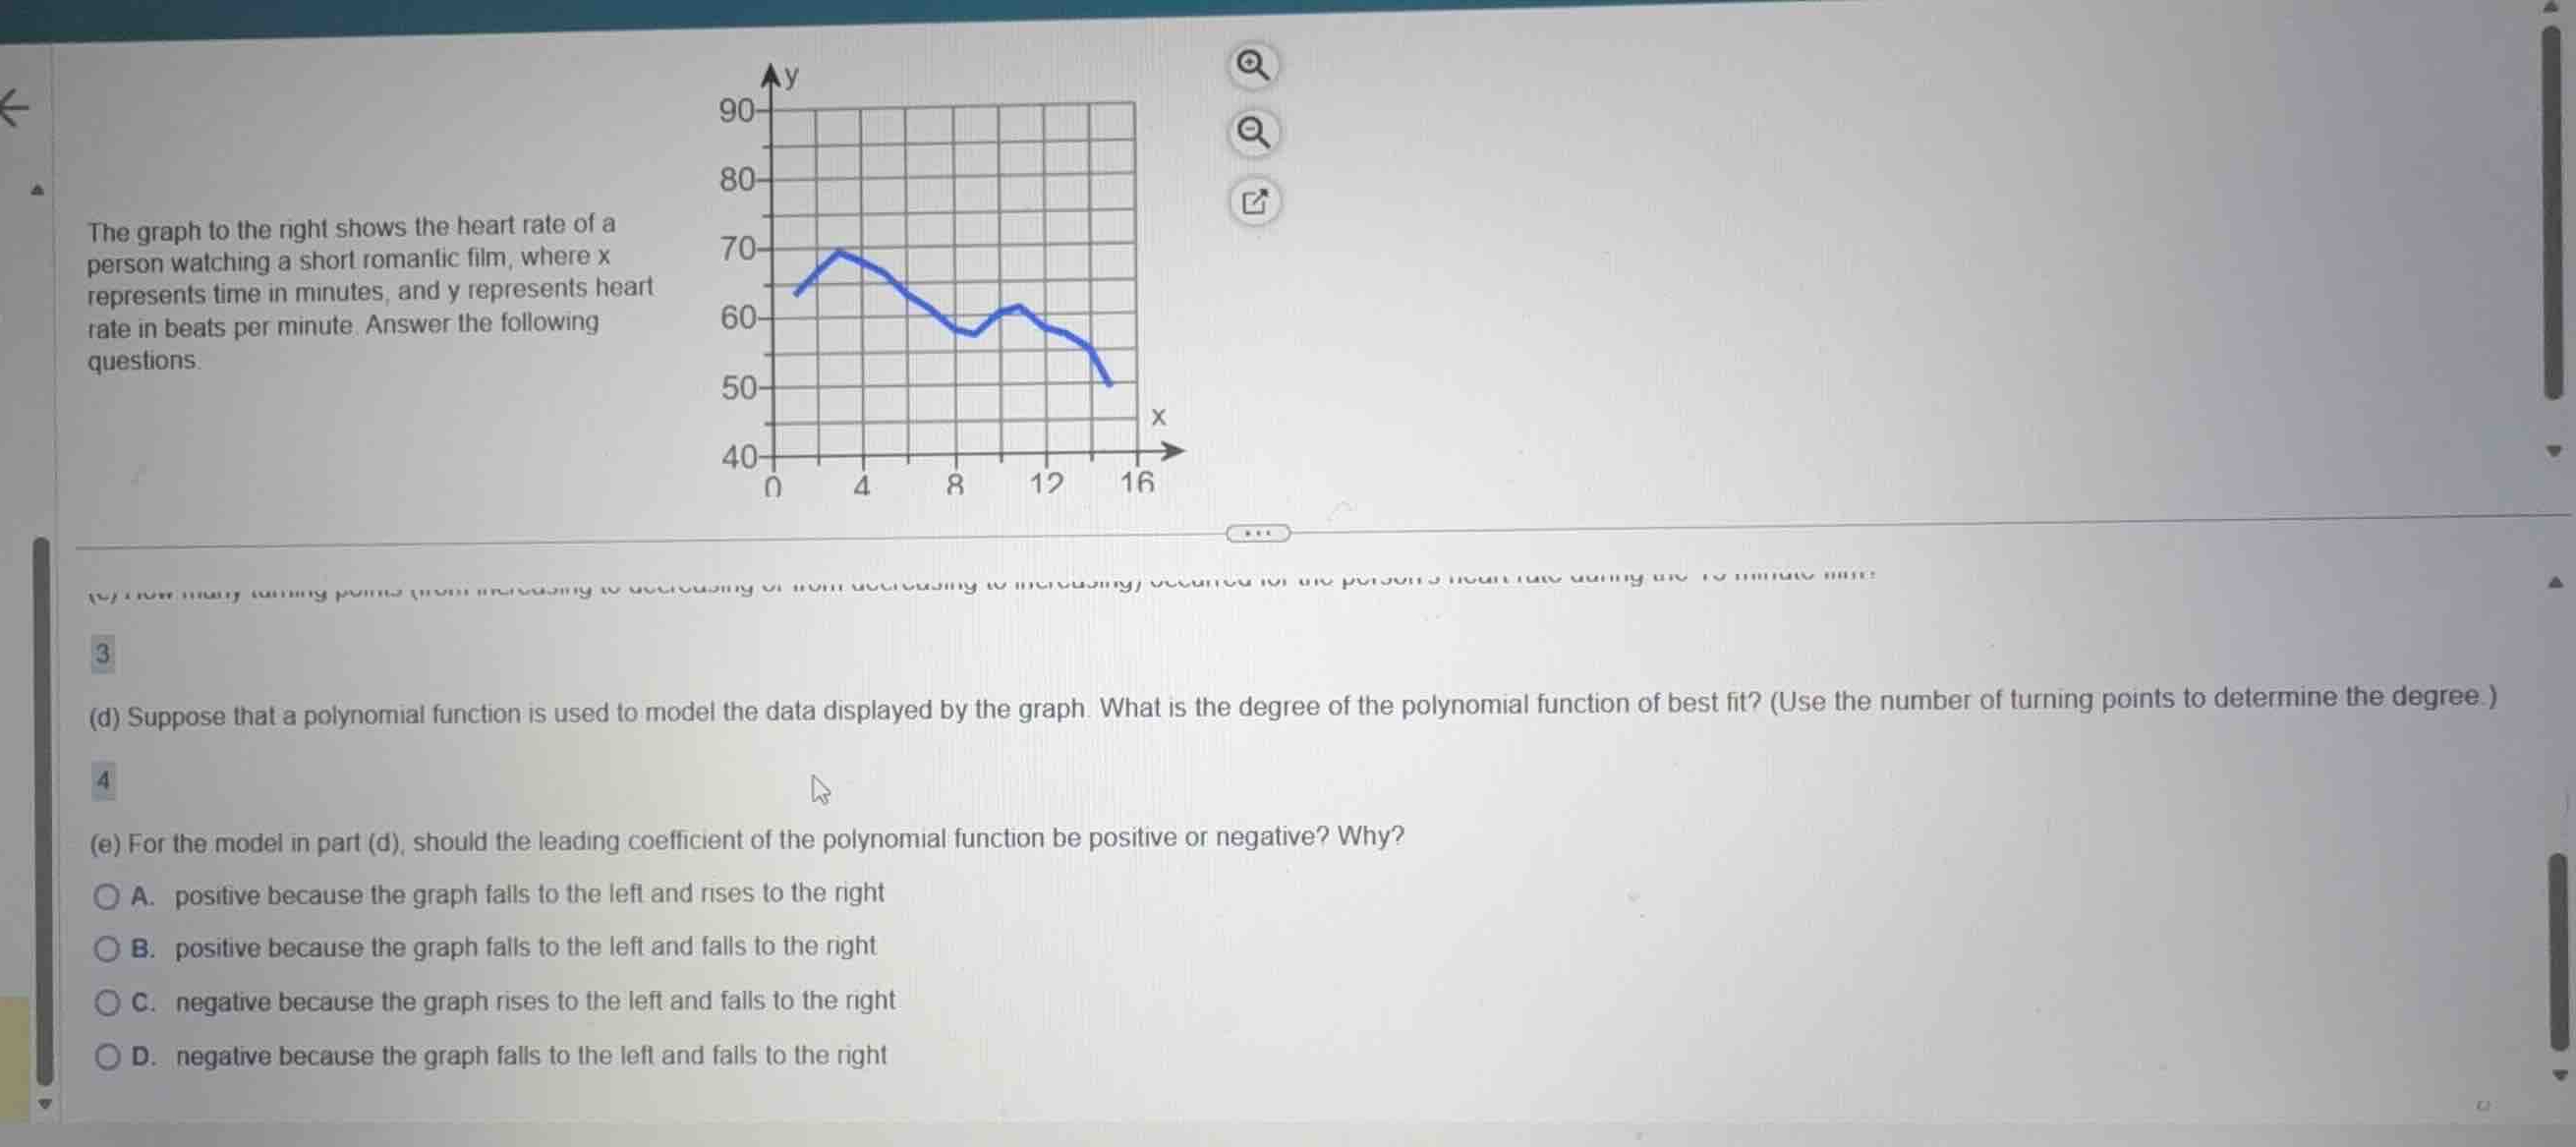
the graph to the right shows the heart rate of a person watching a short romantic film, where x represents time in minutes, and y represents heart rate in beats per minute. answer the following questions.
(c) how many turning points (from increasing to decreasing or from decreasing to increasing) occurred for the persons heart rate during the 15-minute film?
(d) suppose that a polynomial function is used to model the data displayed by the graph. what is the degree of the polynomial function of best fit? (use the number of turning points to determine the degree.)
(e) for the model in part (d), should the leading coefficient of the polynomial function be positive or negative? why?
a. positive because the graph falls to the left and rises to the right
b. positive because the graph falls to the left and falls to the right
c. negative because the graph rises to the left and falls to the right
d. negative because the graph falls to the left and falls to the right
Identify the turning points from the graph
Using the Turning Points knowledge point, we count the local extrema (peaks and valleys) on the interval \(x \in [0, 15]\):
- A local maximum (peak) occurs at approximately \(x = 3\).
- A local minimum (valley) occurs at approximately \(x = 9\).
- Another local maximum (peak) occurs at approximately \(x = 11\).
Thus, there are exactly 3 turning points.
Determine the degree of the polynomial
Using the Degree of Polynomial knowledge point, a polynomial of degree \(n\) has at most \(n-1\) turning points.
Conversely, the minimum degree of a polynomial with \(k\) turning points is \(k + 1\).
Since there are \(3\) turning points:
Analyze the end behavior
Using the End Behavior of Polynomials knowledge point, we observe the graph's behavior at its outer edges:
- As we move to the left (towards \(x = 0\)), the graph rises.
- As we move to the right (towards \(x = 15\)), the graph falls.
Determine the sign of the leading coefficient
Using the Leading Coefficient Test knowledge point:
- For an even-degree polynomial (degree 4), both ends must point in the same direction.
- However, looking at the trend of the model over its domain, the graph rises to the left and falls to the right.
- Let's match the options provided in part (e):
- Option A: positive because the graph falls to the left and rises to the right
- Option B: positive because the graph falls to the left and falls to the right
- Option C: negative because the graph rises to the left and falls to the right
- Option D: negative because the graph falls to the left and falls to the right
The option that correctly describes our observed end behavior is Option C.

Snap & solve any problem in the app
Get step-by-step solutions on Sovi AI
Photo-based solutions with guided steps
Explore more problems and detailed explanations
Question 1
The number of turning points is 3.
Question 2
The degree of the polynomial function of best fit is 4.
Question 3
- A. positive because the graph falls to the left and rises to the right
- B. positive because the graph falls to the left and falls to the right
- C. negative because the graph rises to the left and falls to the right (Correct answer)
- D. negative because the graph falls to the left and falls to the right