QUESTION IMAGE
Question
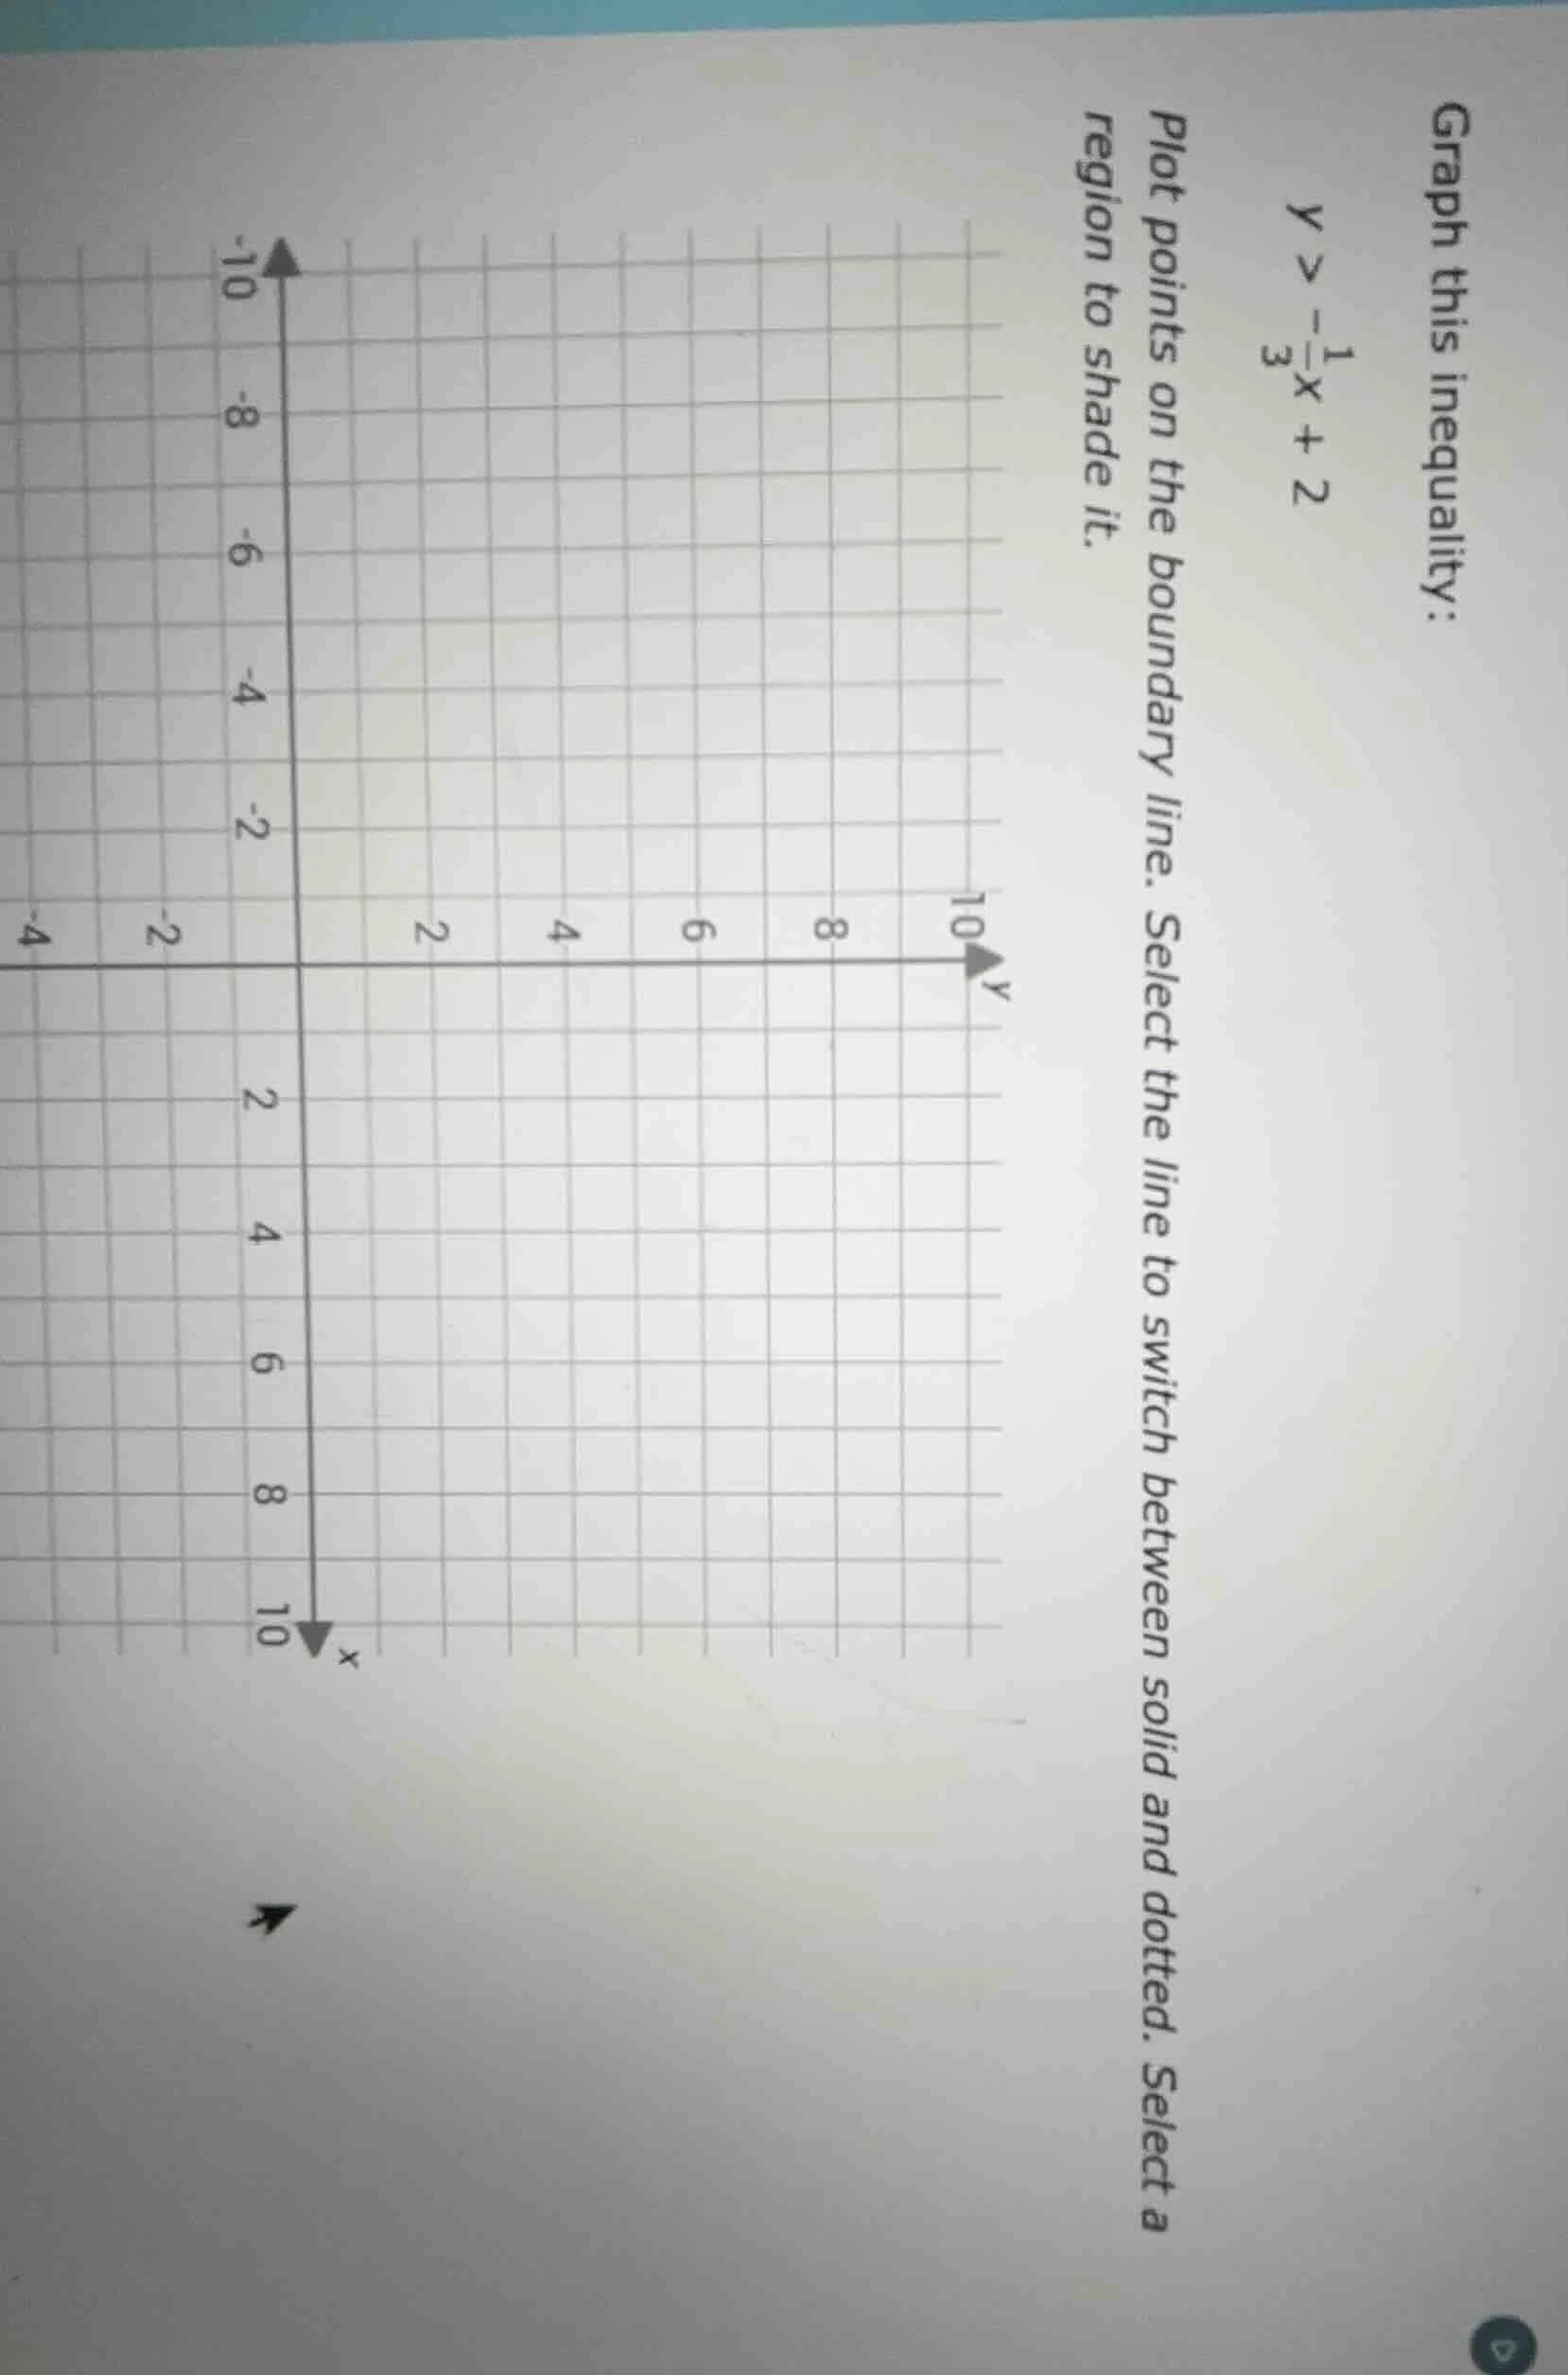
graph this inequality:
$y > -\frac{1}{3}x + 2$
plot points on the boundary line. select the line to switch between solid and dotted. select a region to shade it.
Step1: Identify boundary line
The boundary is $y = -\frac{1}{3}x + 2$, a dotted line (since $>$ is used, no equality).
Step2: Find y-intercept
When $x=0$, $y = -\frac{1}{3}(0)+2=2$. Point: $(0, 2)$
Step3: Find x-intercept
When $y=0$, $0 = -\frac{1}{3}x + 2$
$\frac{1}{3}x=2$
$x=6$. Point: $(6, 0)$
Step4: Test a point for shading
Use $(0,0)$: $0 > -\frac{1}{3}(0)+2$ → $0>2$ (false). Shade opposite region (above the line).

Snap & solve any problem in the app
Get step-by-step solutions on Sovi AI
Photo-based solutions with guided steps
Explore more problems and detailed explanations
- Draw a dotted line connecting the points $(0, 2)$ and $(6, 0)$.
- Shade the entire region above this dotted line.