QUESTION IMAGE
Question
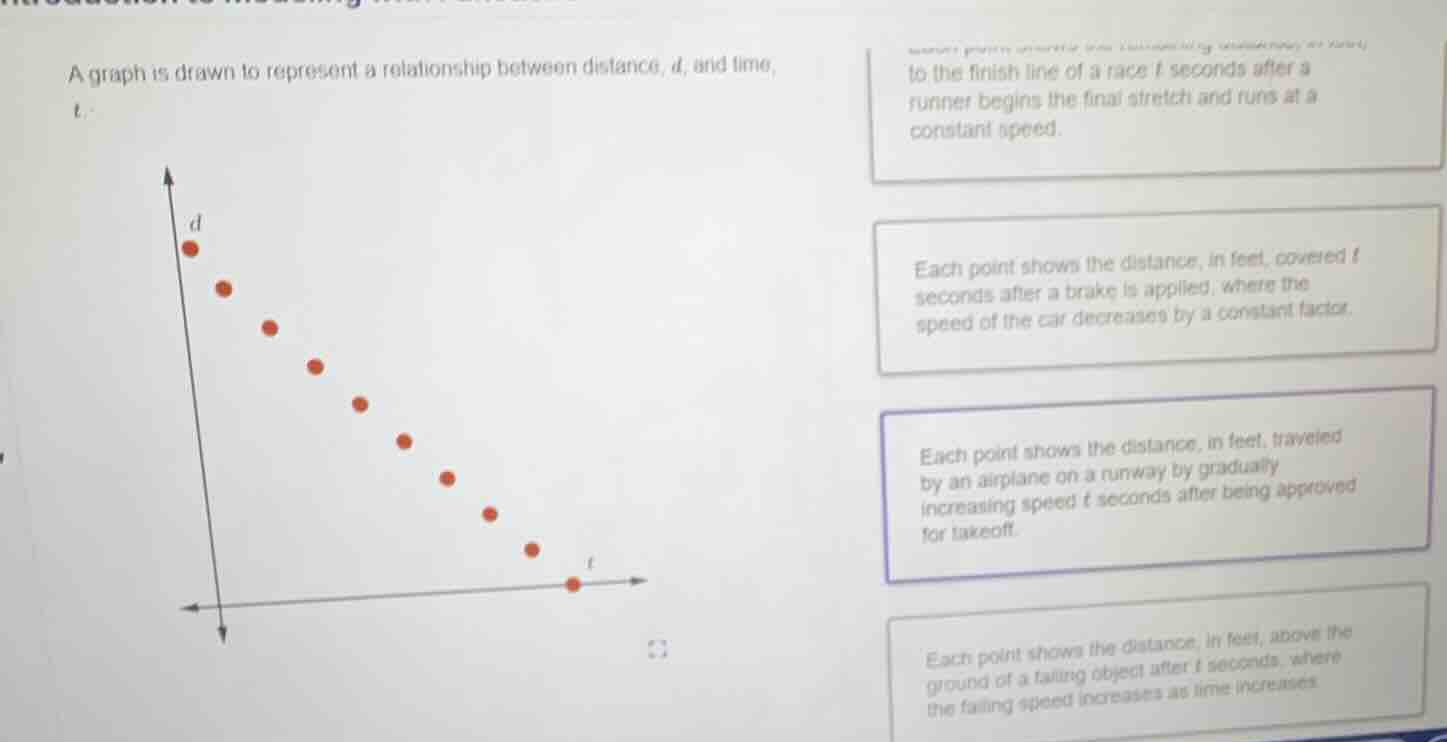
a graph is drawn to represent a relationship between distance, (d), and time, (t).
option 1: each point shows the distance, in feet, remaining to the finish line of a race (t) seconds after a runner begins the final stretch and runs at a constant speed.
option 2: each point shows the distance, in feet, covered (t) seconds after a brake is applied, where the speed of the car decreases by a constant factor.
option 3: each point shows the distance, in feet, traveled by an airplane on a runway by gradually increasing speed (t) seconds after being approved for takeoff.
option 4: each point shows the distance, in feet, above the ground of a falling object after (t) seconds, where the falling speed increases as time increases.
Analyze the graph's characteristics
Using the Linear Modeling and Constant Rate of Change knowledge points
- The graph shows discrete points representing a relationship between distance \(d\) (vertical axis) and time \(t\) (horizontal axis).
- The points lie perfectly along a straight line with a negative slope.
- This indicates that distance \(d\) decreases at a constant rate as time \(t\) increases.
Evaluate the first option
Using the Linear Modeling and Constant Rate of Change knowledge points
- The first option describes a runner's distance to the finish line of a race \(t\) seconds after starting the final stretch at a constant speed.
- As time \(t\) increases, the remaining distance to the finish line decreases at a constant rate (constant speed).
- This perfectly matches a linear relationship with a negative slope.
Evaluate the second option
Using the Linear Modeling and Constant Rate of Change knowledge points
- The second option describes a car's speed decreasing by a constant factor.
- A constant factor change represents exponential decay, which would produce a curved graph rather than a straight line.
Evaluate the third option
Using the Linear Modeling and Constant Rate of Change knowledge points
- The third option describes an airplane on a runway gradually increasing its speed.
- An increasing speed means the distance traveled per unit of time is increasing, which would produce a curve with an increasing slope (quadratic/exponential growth).
Evaluate the fourth option
Using the Linear Modeling and Constant Rate of Change knowledge points
- The fourth option describes a falling object whose falling speed increases as time increases.
- An increasing falling speed means the distance above the ground decreases at an accelerating rate, which would produce a downward-curving quadratic path.

Snap & solve any problem in the app
Get step-by-step solutions on Sovi AI
Photo-based solutions with guided steps
Explore more problems and detailed explanations
- (A) Each point shows the distance, in feet, remaining to the finish line of a race t seconds after a runner begins the final stretch and runs at a constant speed. (Correct answer)
- (B) Each point shows the distance, in feet, covered t seconds after a brake is applied, where the speed of the car decreases by a constant factor.
- (C) Each point shows the distance, in feet, traveled by an airplane on a runway by gradually increasing speed t seconds after being approved for takeoff.
- (D) Each point shows the distance, in feet, above the ground of a falling object after t seconds, where the falling speed increases as time increases.