QUESTION IMAGE
Question
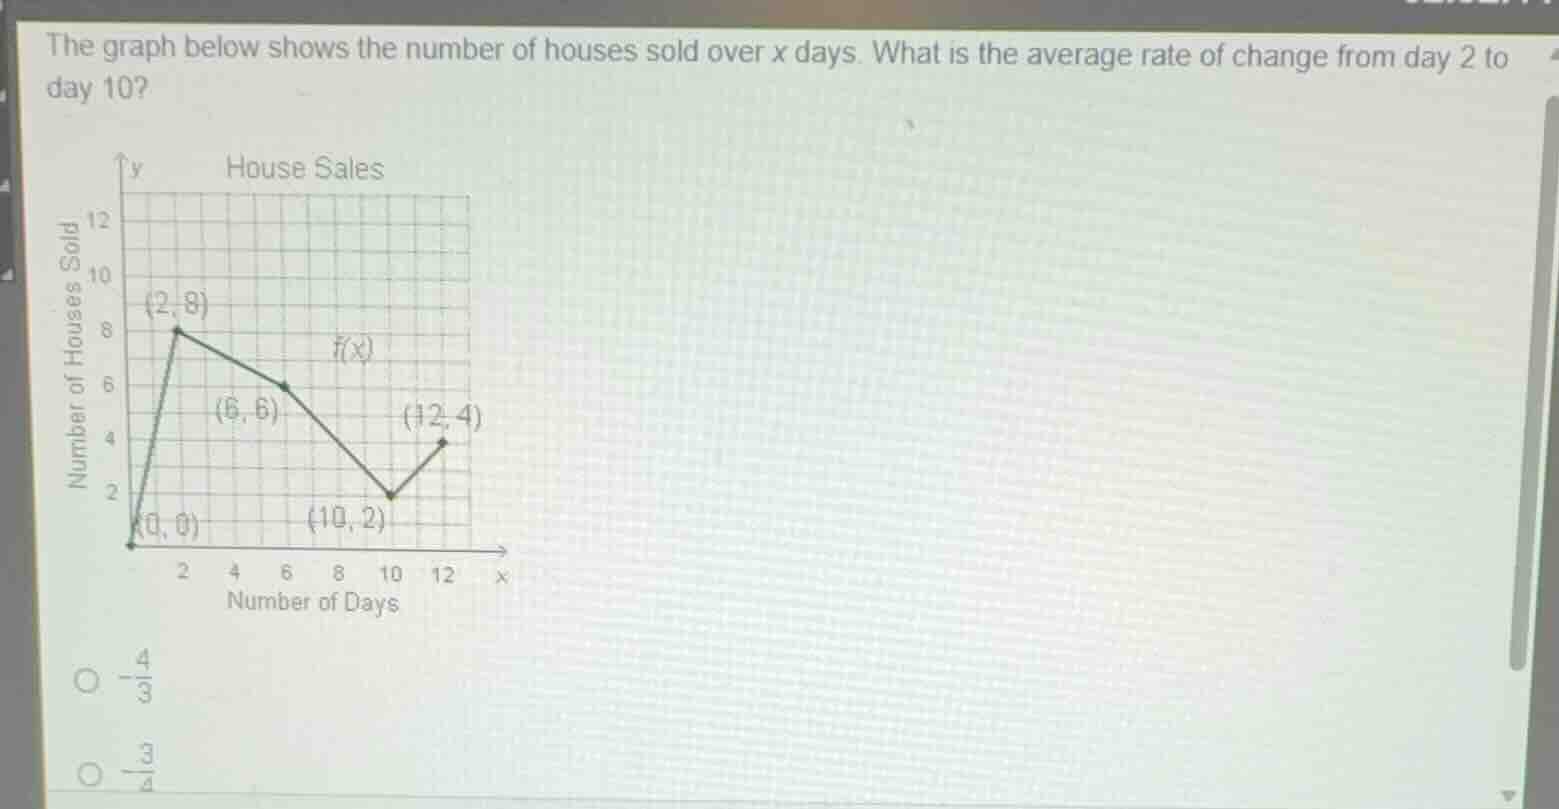
the graph below shows the number of houses sold over x days. what is the average rate of change from day 2 to day 10?
house sales
number of houses sold
number of days
\\(-\frac{4}{3}\\)
\\(-\frac{3}{4}\\)
Identify the coordinates from the graph
Using the Average Rate of Change knowledge point
$$
LATEXBLOCK0
$$
Calculate the average rate of change
Using the Average Rate of Change knowledge point
$$
LATEXBLOCK1
$$

Snap & solve any problem in the app
Get step-by-step solutions on Sovi AI
Photo-based solutions with guided steps
Explore more problems and detailed explanations
- (A) \(-\frac{4}{3}\)
- (B) \(-\frac{3}{4}\) (Correct answer)