QUESTION IMAGE
Question
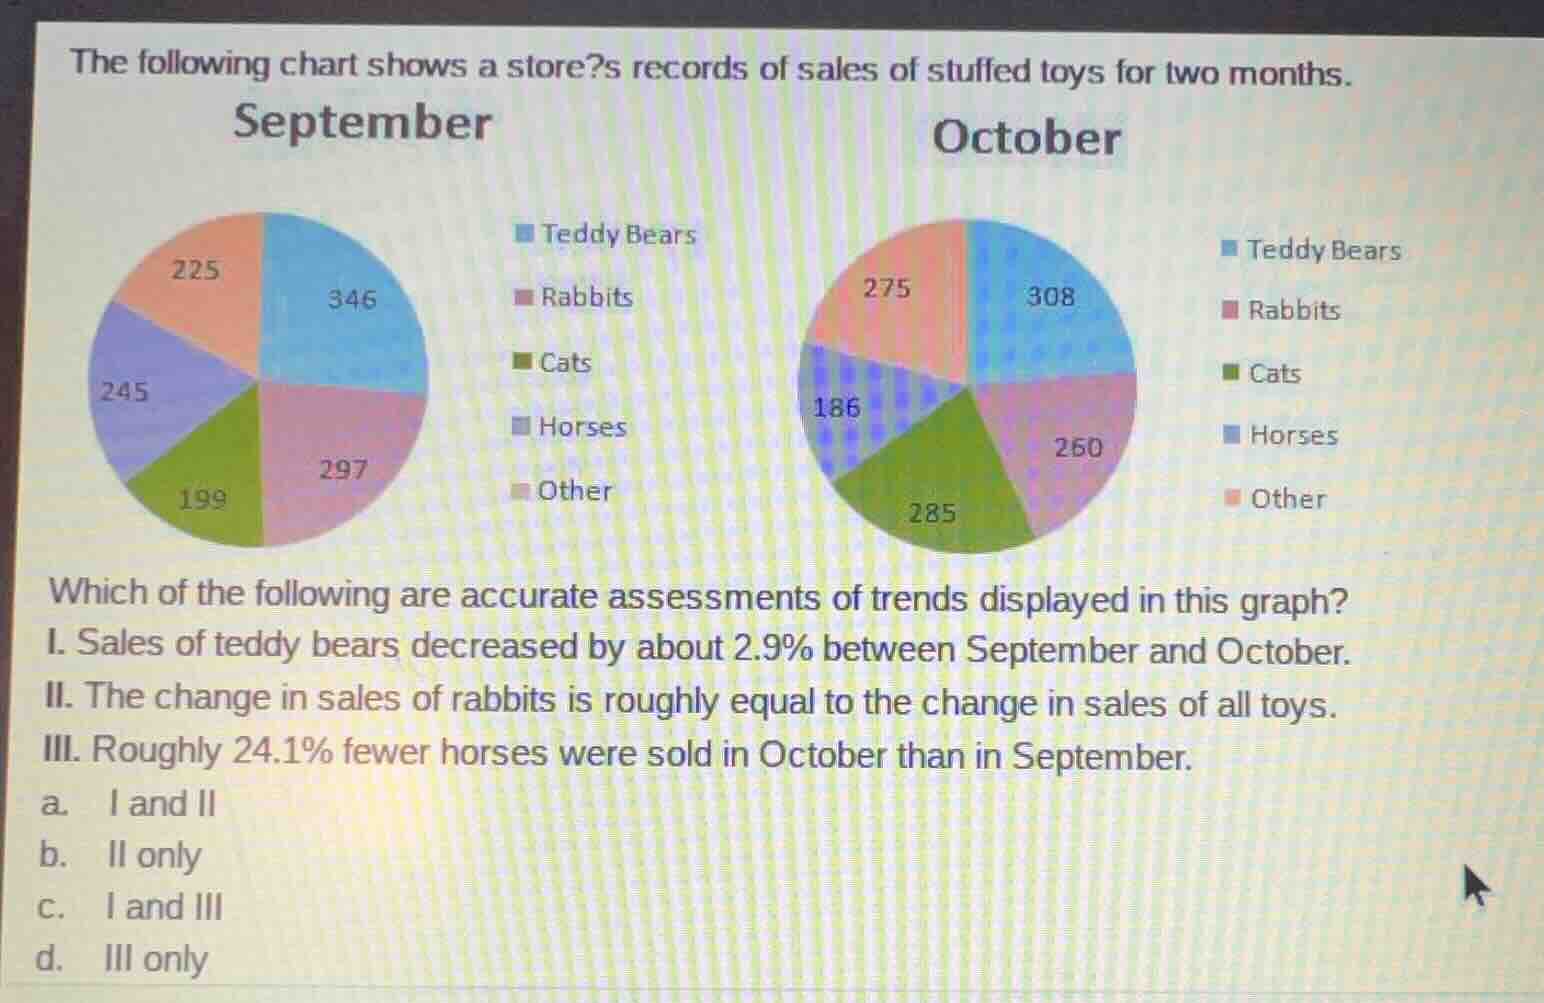
the following chart shows a stores records of sales of stuffed toys for two months.
which of the following are accurate assessments of trends displayed in this graph?
i. sales of teddy bears decreased by about 2.9% between september and october.
ii. the change in sales of rabbits is roughly equal to the change in sales of all toys.
iii. roughly 24.1% fewer horses were sold in october than in september.
a. i and ii
b. ii only
c. i and iii
d. iii only
Evaluate Statement I
Using the Pie Chart Analysis and Percentage Decrease knowledge points
Since \(10.98\%
eq 2.9\%\), Statement I is incorrect.
Evaluate Statement II
Using the Pie Chart Analysis and Percentage Decrease knowledge points
Since \(-37
eq +2\), the change in rabbit sales is not roughly equal to the change in total sales. Statement II is incorrect.
Evaluate Statement III
Using the Pie Chart Analysis and Percentage Decrease knowledge points
Since \(24.08\% \approx 24.1\%\), Statement III is correct.

Snap & solve any problem in the app
Get step-by-step solutions on Sovi AI
Photo-based solutions with guided steps
Explore more problems and detailed explanations
- a. I and II
- b. II only
- c. I and III
- d. III only (Correct answer)