QUESTION IMAGE
Question
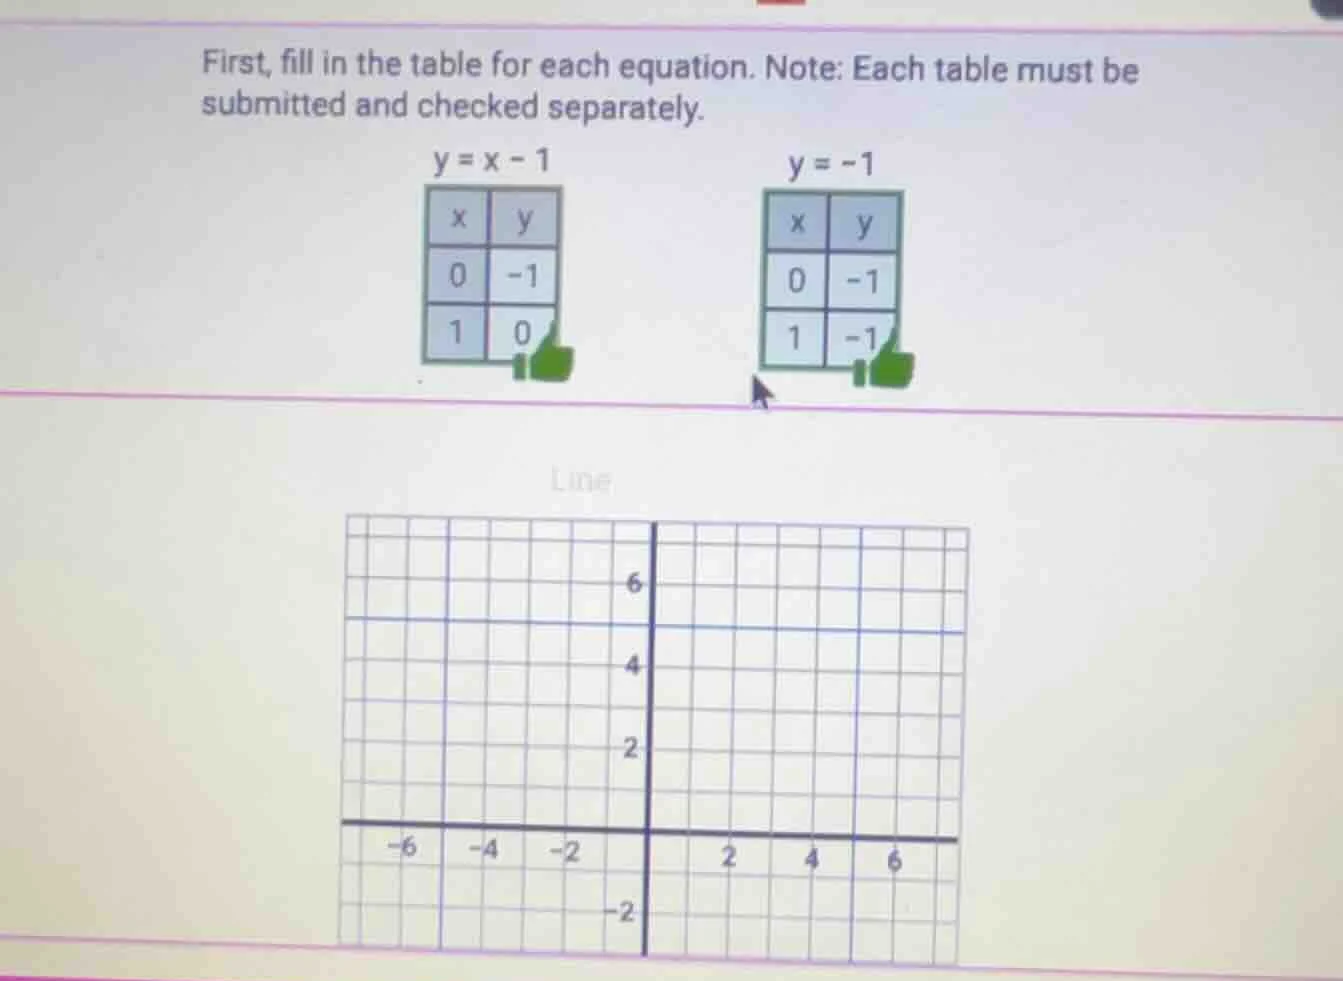
first, fill in the table for each equation. note: each table must be submitted and checked separately.
y = x - 1
x | y
0 | -1
1 | 0
y = -1
x | y
0 | -1
1 | -1
line (with a coordinate grid showing x from -6 to 6 and y from -2 to 6)
To solve the problem of filling the tables and graphing the lines, we analyze each equation:
For the equation \( y = x - 1 \):
We can find more points to complete the table. Let's choose \( x = 2 \):
Step 1: Substitute \( x = 2 \) into \( y = x - 1 \)
\( y = 2 - 1 = 1 \)
So when \( x = 2 \), \( y = 1 \).
For the equation \( y = -1 \):
This is a horizontal line where \( y \) is always -1, regardless of the value of \( x \). So for any \( x \) (e.g., \( x = 2 \)), \( y = -1 \).
Graphing the lines:
- For \( y = x - 1 \), plot the points \((0, -1)\), \((1, 0)\), \((2, 1)\) and draw a straight line through them.
- For \( y = -1 \), plot the points \((0, -1)\), \((1, -1)\), \((2, -1)\) and draw a horizontal straight line through them.
If we were to complete the tables with \( x = 2 \):
Table for \( y = x - 1 \):
| \( x \) | \( y \) |
|---|---|
| 1 | 0 |
| 2 | 1 |
Table for \( y = -1 \):
| \( x \) | \( y \) |
|---|---|
| 1 | -1 |
| 2 | -1 |
(Note: The problem didn't specify a particular \( x \)-value to use for completion, but the above shows how to extend the tables. The graphs would be a line with slope 1 (for \( y = x - 1 \)) and a horizontal line (for \( y = -1 \)) intersecting at \((0, -1)\).)

Snap & solve any problem in the app
Get step-by-step solutions on Sovi AI
Photo-based solutions with guided steps
Explore more problems and detailed explanations
To solve the problem of filling the tables and graphing the lines, we analyze each equation:
For the equation \( y = x - 1 \):
We can find more points to complete the table. Let's choose \( x = 2 \):
Step 1: Substitute \( x = 2 \) into \( y = x - 1 \)
\( y = 2 - 1 = 1 \)
So when \( x = 2 \), \( y = 1 \).
For the equation \( y = -1 \):
This is a horizontal line where \( y \) is always -1, regardless of the value of \( x \). So for any \( x \) (e.g., \( x = 2 \)), \( y = -1 \).
Graphing the lines:
- For \( y = x - 1 \), plot the points \((0, -1)\), \((1, 0)\), \((2, 1)\) and draw a straight line through them.
- For \( y = -1 \), plot the points \((0, -1)\), \((1, -1)\), \((2, -1)\) and draw a horizontal straight line through them.
If we were to complete the tables with \( x = 2 \):
Table for \( y = x - 1 \):
| \( x \) | \( y \) |
|---|---|
| 1 | 0 |
| 2 | 1 |
Table for \( y = -1 \):
| \( x \) | \( y \) |
|---|---|
| 1 | -1 |
| 2 | -1 |
(Note: The problem didn't specify a particular \( x \)-value to use for completion, but the above shows how to extend the tables. The graphs would be a line with slope 1 (for \( y = x - 1 \)) and a horizontal line (for \( y = -1 \)) intersecting at \((0, -1)\).)