QUESTION IMAGE
Question
figure 1
graph 1
$
total units produced
graph 2
$
total units produced
graph 3
$
total units produced
graph 4
$
total units produced
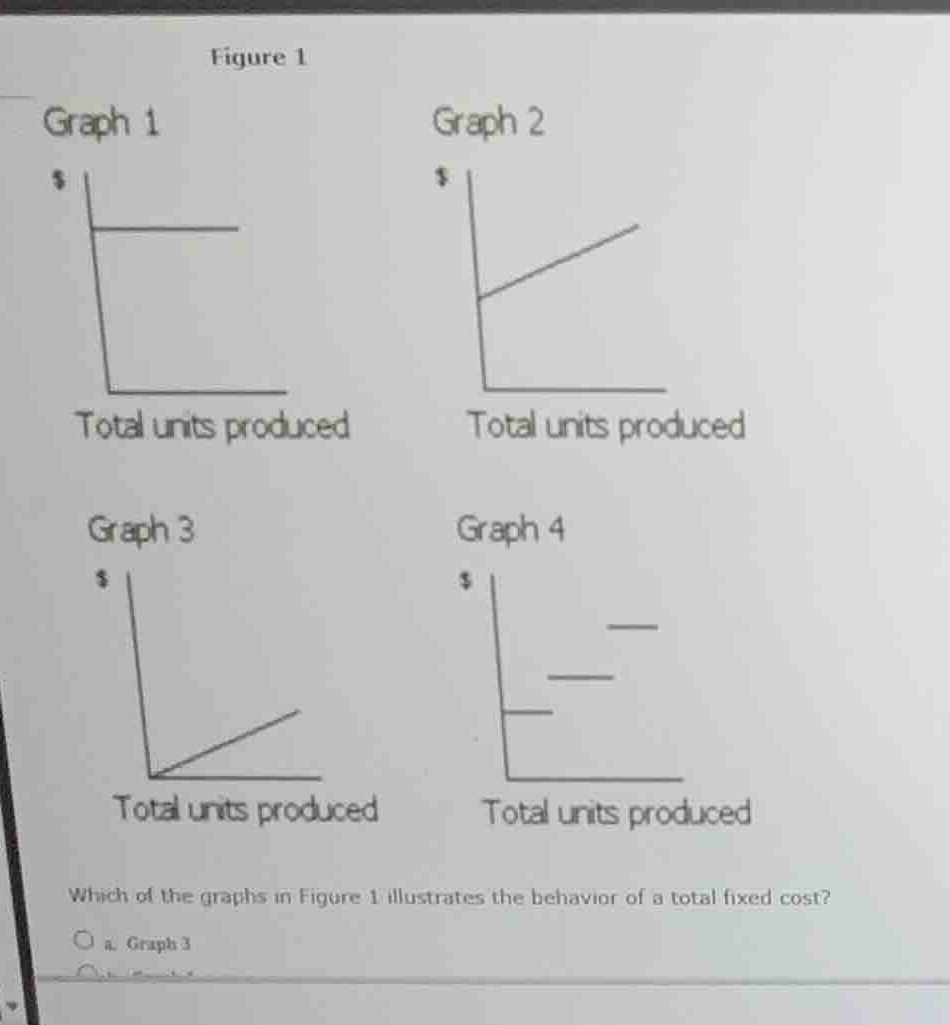
which of the graphs in figure 1 illustrates the behavior of a total fixed cost?
a. graph 3
<pre_analysis>
{
"quality": "clear",
"question_count": 1,
"skills_matched": [
"direct_cot",
"multiple_choice_formatter",
"explain_then_answer",
"tutor",
"mastery_adaptive_brevity"
],
"needs_drawing": false,
"concepts_used": [
"Fixed Cost"
],
"new_concepts": [],
"current_concepts": [
"Fixed Cost",
"Variable Cost",
"Mixed Cost",
"Cost Classification"
]
}
</pre_analysis>
<reasoning>
Define total fixed cost behavior
Using the Fixed Cost knowledge point
A total fixed cost remains constant in total dollar amount regardless of changes in the activity level (total units produced) within a relevant range.
Analyze the graphs in Figure 1
Using the Cost Classification knowledge point
- Graph 1 shows a horizontal line, indicating that the total cost in dollars remains constant as the total units produced increase.
- Graph 2 shows a cost that starts above zero and increases linearly, representing a mixed cost.
- Graph 3 shows a cost that starts at zero and increases linearly, representing a total variable cost.
- Graph 4 shows a cost that increases in steps, representing a step cost.
Match behavior to the correct graph
Using the Fixed Cost knowledge point
Since total fixed cost does not change with production volume, its behavior is represented by a flat, horizontal line. This matches Graph 1.
</reasoning>
<answer>
<mcq-correct>(b) Graph 1</mcq-correct>
<mcq-option>(a) Graph 3</mcq-option>
<mcq-option>(c) Graph 2</mcq-option>
<mcq-option>(d) Graph 4</mcq-option>
</answer>
<post_analysis>
{
"subject": "Business",
"question_type": "Multiple Choice",
"knowledge_point": [
"Business",
"Accounting",
"Fixed Cost"
]
}
</post_analysis>

Snap & solve any problem in the app
Get step-by-step solutions on Sovi AI
Photo-based solutions with guided steps
Explore more problems and detailed explanations
<pre_analysis>
{
"quality": "clear",
"question_count": 1,
"skills_matched": [
"direct_cot",
"multiple_choice_formatter",
"explain_then_answer",
"tutor",
"mastery_adaptive_brevity"
],
"needs_drawing": false,
"concepts_used": [
"Fixed Cost"
],
"new_concepts": [],
"current_concepts": [
"Fixed Cost",
"Variable Cost",
"Mixed Cost",
"Cost Classification"
]
}
</pre_analysis>
<reasoning>
Define total fixed cost behavior
Using the Fixed Cost knowledge point
A total fixed cost remains constant in total dollar amount regardless of changes in the activity level (total units produced) within a relevant range.
Analyze the graphs in Figure 1
Using the Cost Classification knowledge point
- Graph 1 shows a horizontal line, indicating that the total cost in dollars remains constant as the total units produced increase.
- Graph 2 shows a cost that starts above zero and increases linearly, representing a mixed cost.
- Graph 3 shows a cost that starts at zero and increases linearly, representing a total variable cost.
- Graph 4 shows a cost that increases in steps, representing a step cost.
Match behavior to the correct graph
Using the Fixed Cost knowledge point
Since total fixed cost does not change with production volume, its behavior is represented by a flat, horizontal line. This matches Graph 1.
</reasoning>
<answer>
<mcq-correct>(b) Graph 1</mcq-correct>
<mcq-option>(a) Graph 3</mcq-option>
<mcq-option>(c) Graph 2</mcq-option>
<mcq-option>(d) Graph 4</mcq-option>
</answer>
<post_analysis>
{
"subject": "Business",
"question_type": "Multiple Choice",
"knowledge_point": [
"Business",
"Accounting",
"Fixed Cost"
]
}
</post_analysis>