QUESTION IMAGE
Question
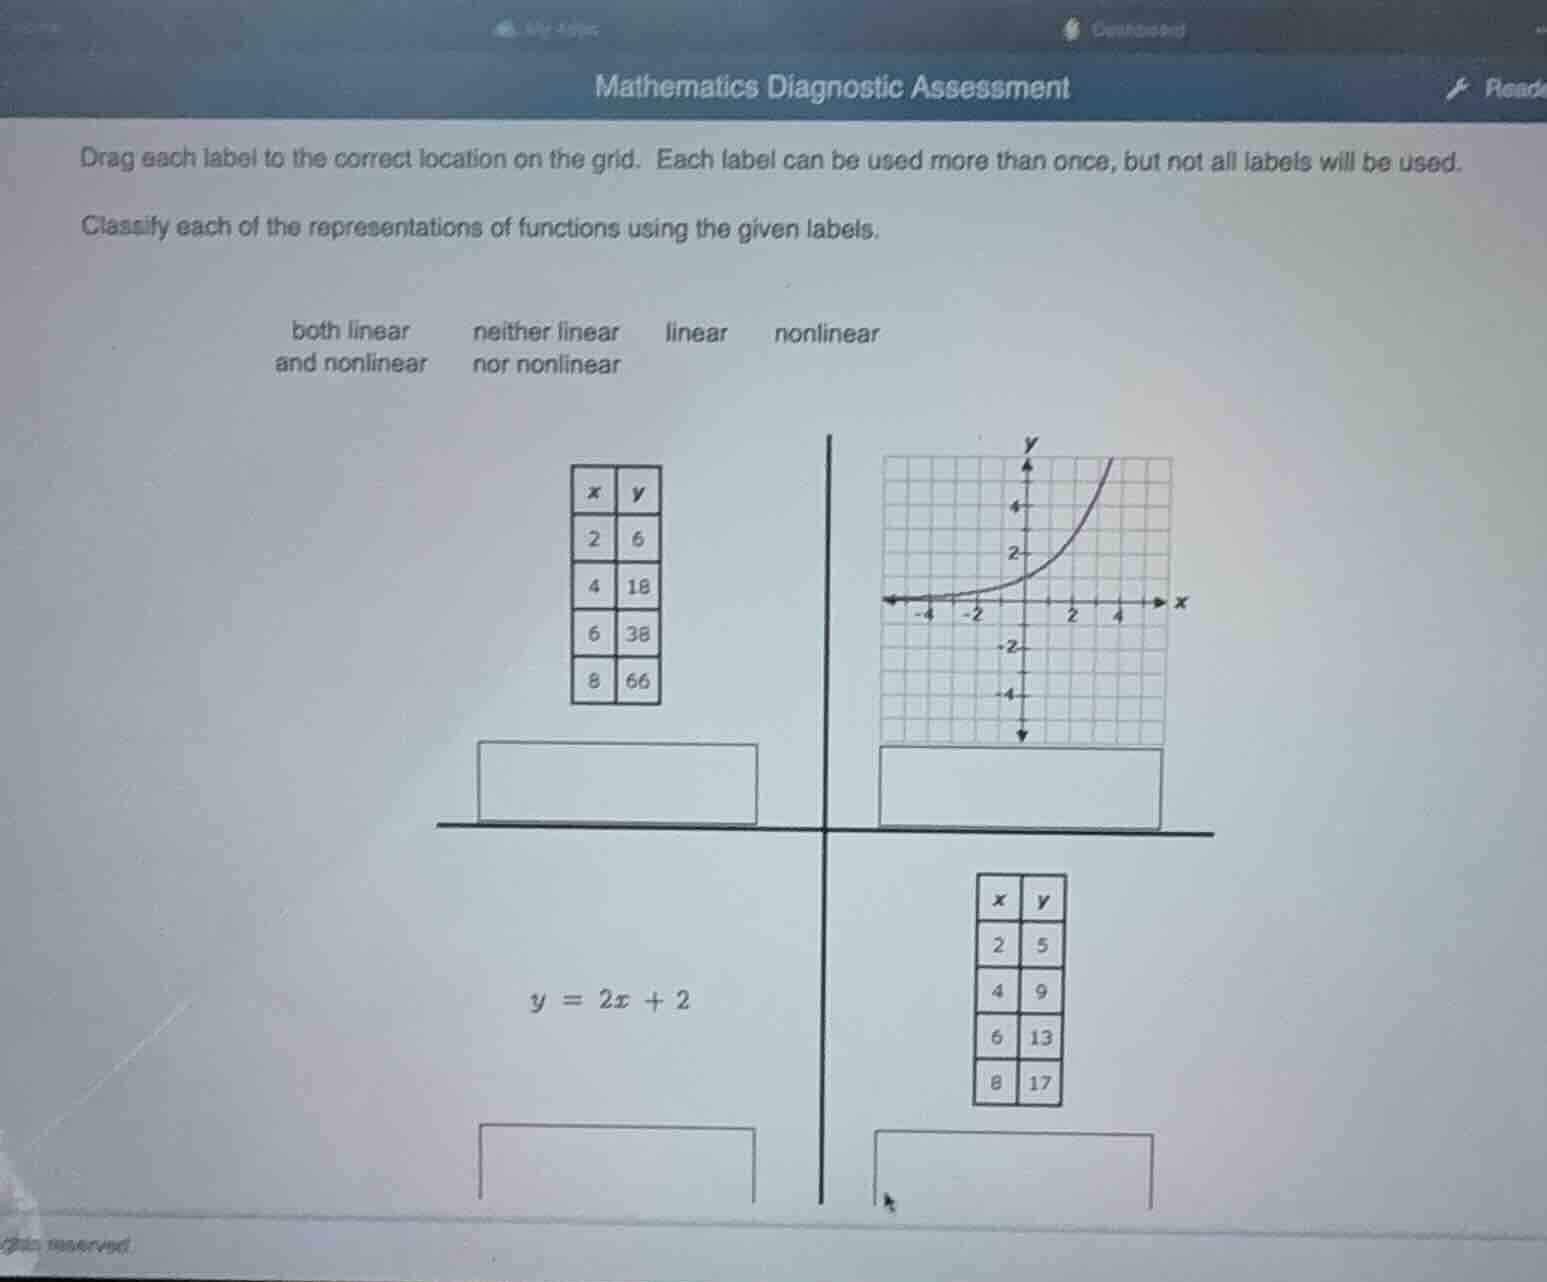
drag each label to the correct location on the grid. each label can be used more than once, but not all labels will be used. classify each of the representations of functions using the given labels. both linear neither linear linear nonlinear and nonlinear nor nonlinear x y 2 6 4 18 6 38 8 66 y = 2x + 2 x y 2 5 4 9 6 13 8 17
Step1: Check 1st table for linearity
Calculate rate of change:
$\frac{18-6}{4-2}=6$, $\frac{38-18}{6-4}=10$, $\frac{66-38}{8-6}=14$
Rates are not constant.
Step2: Classify 1st table
Non-constant rate = nonlinear
Step3: Check graph for linearity
Graph is a curve, not straight line = nonlinear
Step4: Check equation $y=2x+2$
Follows linear form $y=mx+b$ = linear
Step5: Check 2nd table for linearity
Calculate rate of change:
$\frac{9-5}{4-2}=2$, $\frac{13-9}{6-4}=2$, $\frac{17-13}{8-6}=2$
Rates are constant = linear

Snap & solve any problem in the app
Get step-by-step solutions on Sovi AI
Photo-based solutions with guided steps
Explore more problems and detailed explanations
- Top left table: nonlinear
- Top right graph: nonlinear
- Bottom left equation $y=2x+2$: linear
- Bottom right table: linear