QUESTION IMAGE
Question
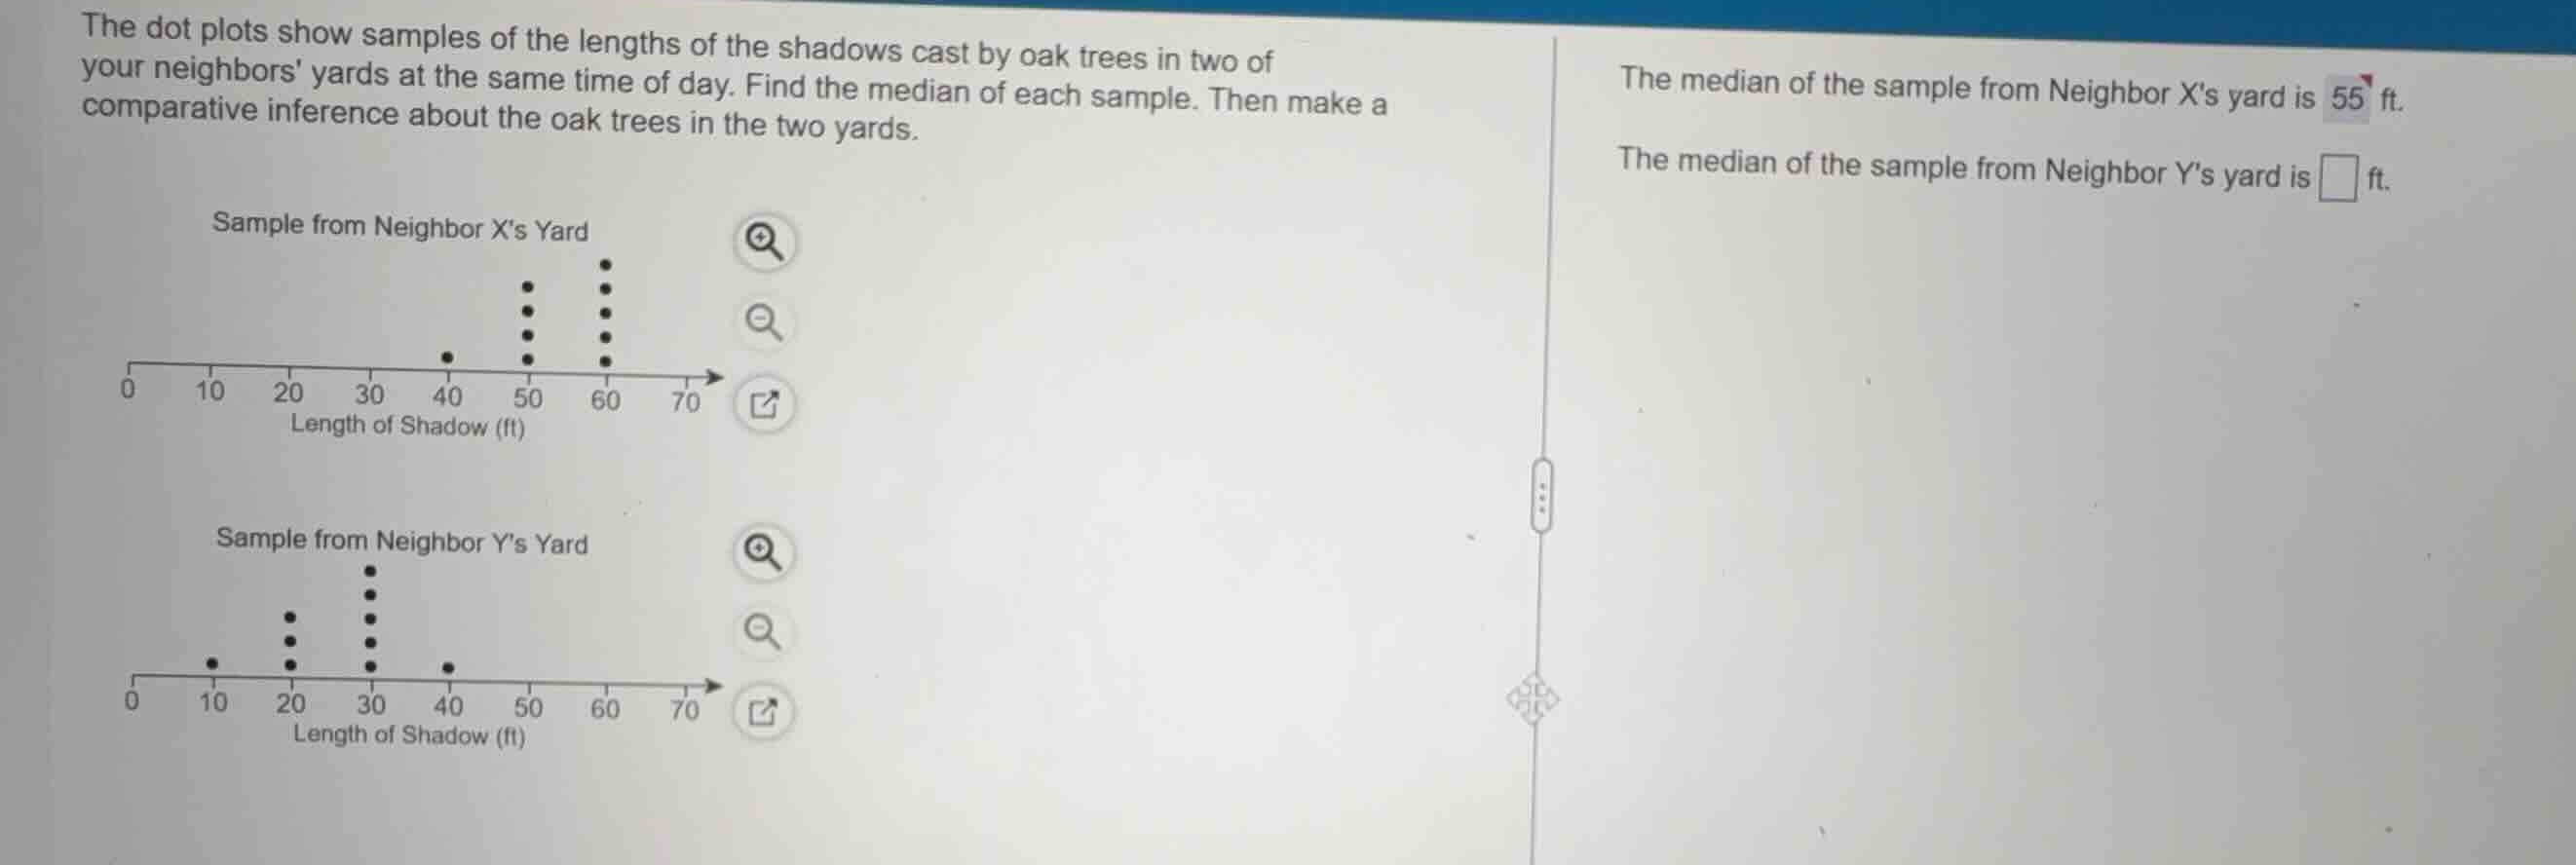
the dot plots show samples of the lengths of the shadows cast by oak trees in two of your neighbors yards at the same time of day. find the median of each sample. then make a comparative inference about the oak trees in the two yards.
the median of the sample from neighbor xs yard is 55 ft.
the median of the sample from neighbor ys yard is ft.
List the data values for Neighbor Y
We count the dots at each value on the dot plot for Neighbor Y's yard:
- At \(10\): \(1\) dot
- At \(20\): \(3\) dots
- At \(30\): \(5\) dots
- At \(40\): \(1\) dot
The ordered data set is:
Find the total number of data points
We sum the number of dots in the sample:
Calculate the median position
Since \(n = 10\) is an even number, the median is the average of the two middle values:
- The \(5^{\text{th}}\) value
- The \(6^{\text{th}}\) value
Find the middle values and calculate the median
Looking at our ordered data set:
- The \(5^{\text{th}}\) value is \(30\).
- The \(6^{\text{th}}\) value is \(30\).
We calculate the average:

Snap & solve any problem in the app
Get step-by-step solutions on Sovi AI
Photo-based solutions with guided steps
Explore more problems and detailed explanations
The median of the sample from Neighbor Y's yard is <blank>30</blank> ft.