QUESTION IMAGE
Question
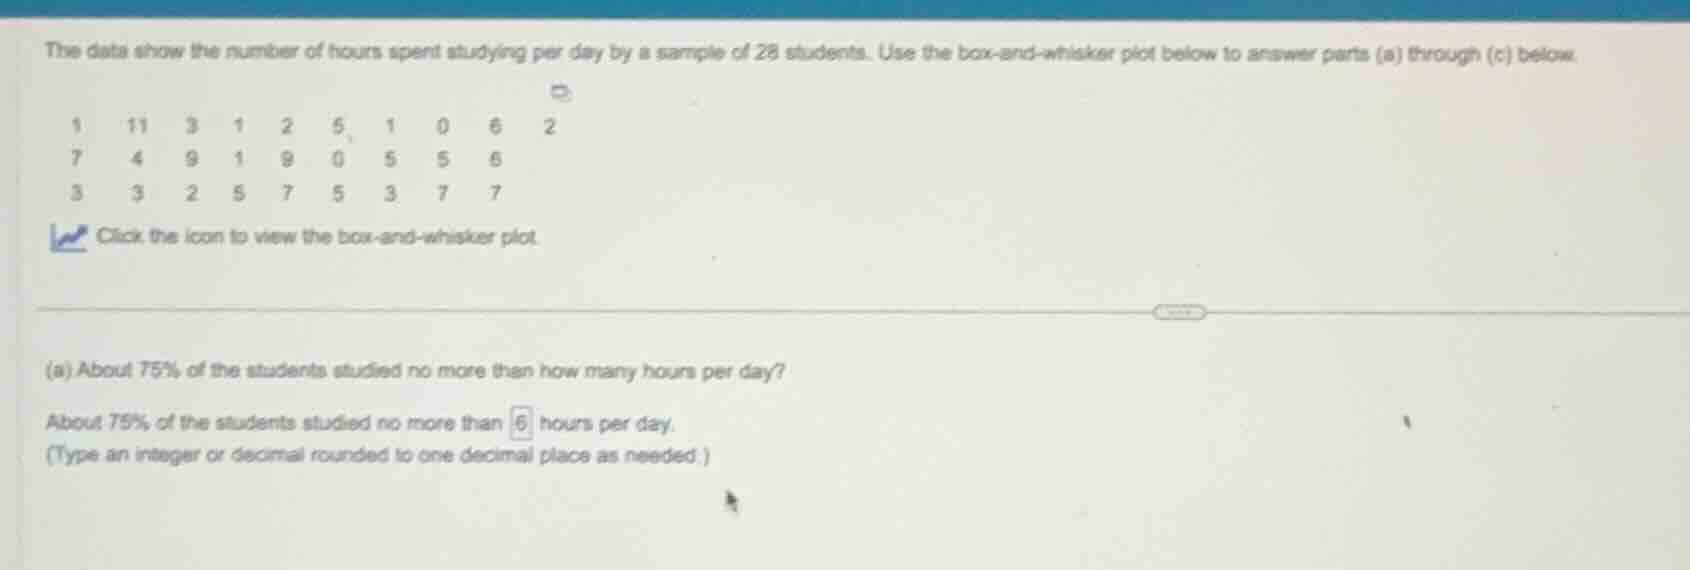
the data show the number of hours spent studying per day by a sample of 28 students. use the box-and-whisker plot below to answer parts (a) through (c) below.
1 11 3 1 2 5 1 0 6 2
7 4 9 1 9 0 5 5 6
3 3 2 5 7 5 3 7 7
click the icon to view the box-and-whisker plot.
(a) about 75% of the students studied no more than how many hours per day?
about 75% of the students studied no more than 6 hours per day.
(type an integer or decimal rounded to one decimal place as needed.)
Sort the dataset
Using the Five-Number Summary knowledge point
Find the third quartile
Using the Box-and-Whisker Plot knowledge point

Snap & solve any problem in the app
Get step-by-step solutions on Sovi AI
Photo-based solutions with guided steps
Explore more problems and detailed explanations
(a) About 75% of the students studied no more than how many hours per day?
About 75% of the students studied no more than <blank>6</blank> hours per day.
(Type an integer or decimal rounded to one decimal place as needed.)