QUESTION IMAGE
Question
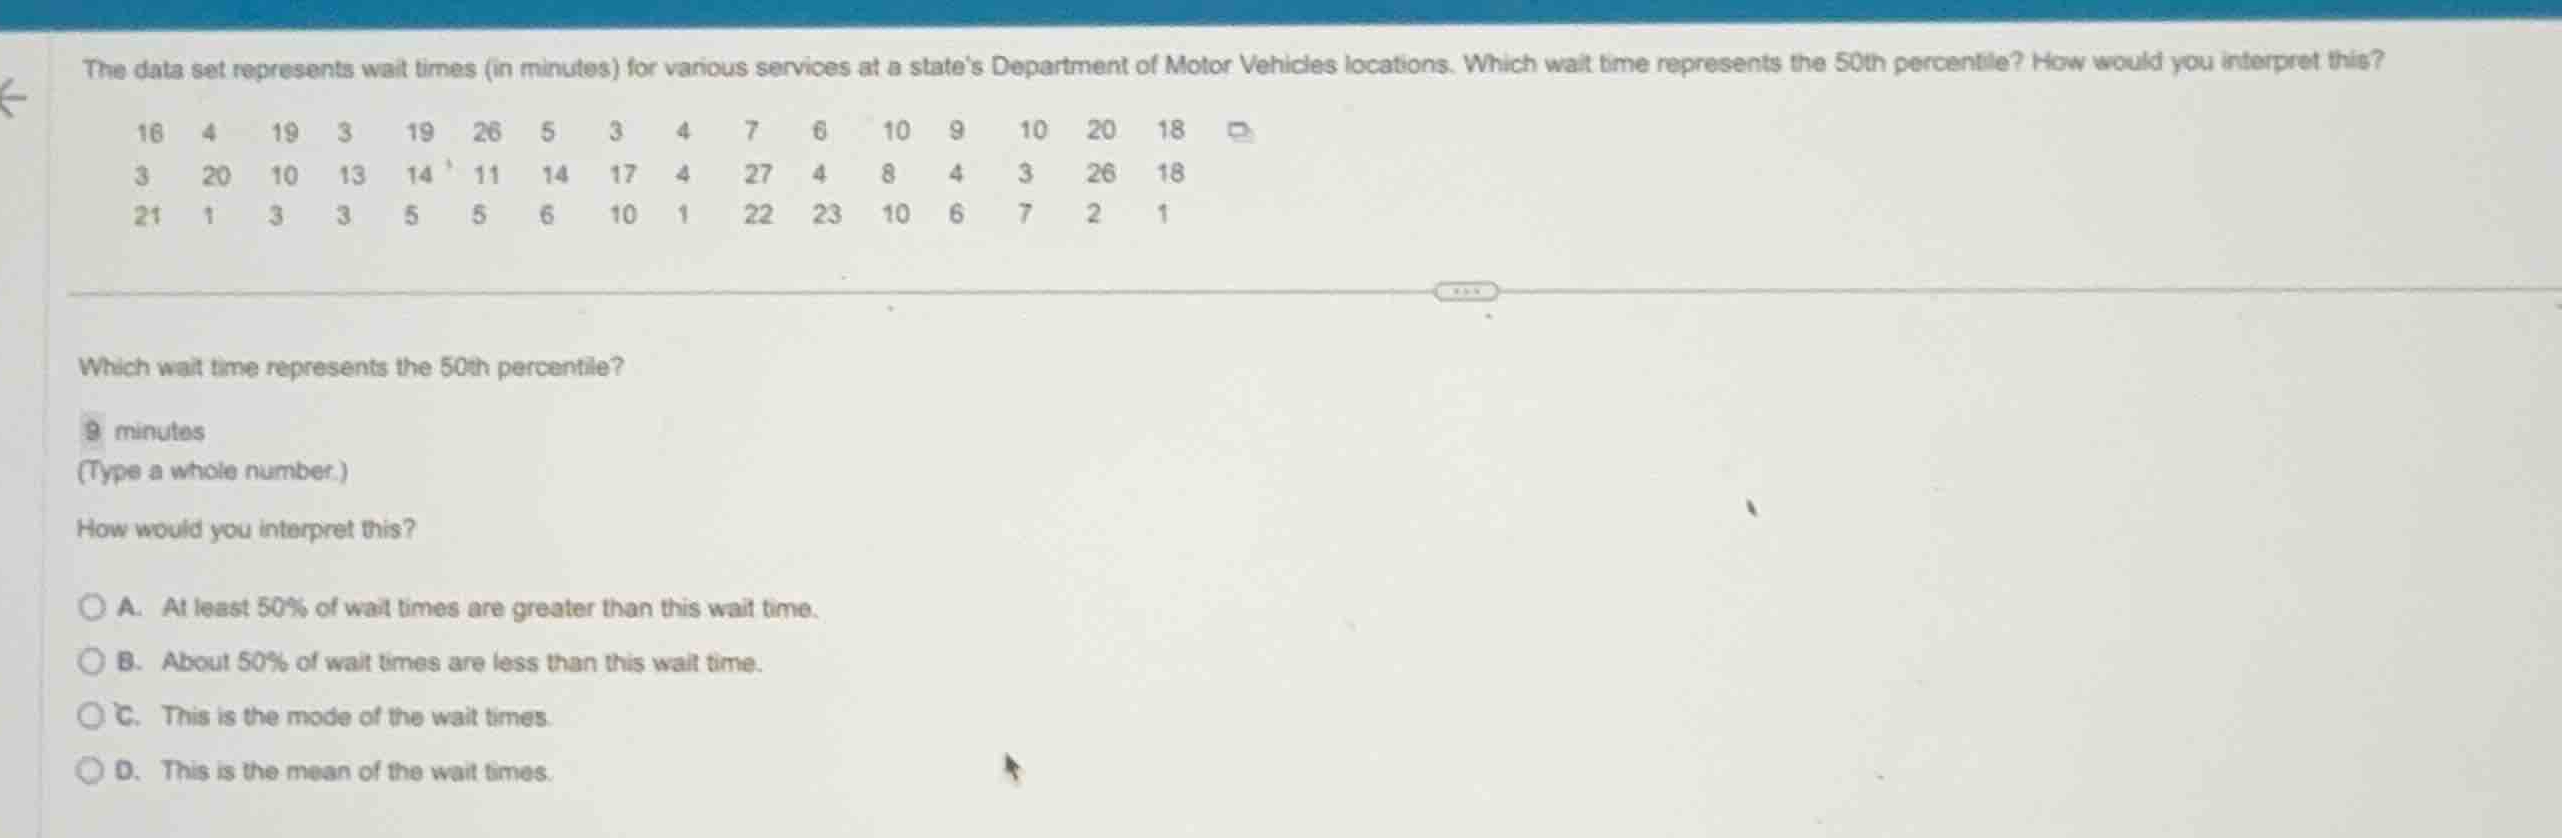
the data set represents wait times (in minutes) for various services at a states department of motor vehicles locations. which wait time represents the 50th percentile? how would you interpret this?
16 4 19 3 19 26 5 3 4 7 6 10 9 10 20 18
3 20 10 13 14 11 14 17 4 27 4 8 4 3 26 18
21 1 3 3 5 5 6 10 1 22 23 10 6 7 2 1
which wait time represents the 50th percentile?
9 minutes
(type a whole number.)
how would you interpret this?
a. at least 50% of wait times are greater than this wait time.
b. about 50% of wait times are less than this wait time.
c. this is the mode of the wait times.
d. this is the mean of the wait times.
Sort the dataset
Using the Percentiles and Quantiles and Median Calculation knowledge points
Find the 50th percentile
Using the Percentiles and Quantiles and Median Calculation knowledge points
Interpret the 50th percentile
The 50th percentile represents the value below which approximately 50% of the observations fall. Therefore, about 50% of the wait times are less than this wait time.

Snap & solve any problem in the app
Get step-by-step solutions on Sovi AI
Photo-based solutions with guided steps
Explore more problems and detailed explanations
Question 1
9
Question 2
- A. At least 50% of wait times are greater than this wait time.
- B. About 50% of wait times are less than this wait time. (Correct answer)
- C. This is the mode of the wait times.
- D. This is the mean of the wait times.