QUESTION IMAGE
Question
construct a frequency distribution of scores on a 50-point test where a few students scored much lower than the majority of students.
choose the correct graph below.
Analyze the distribution description
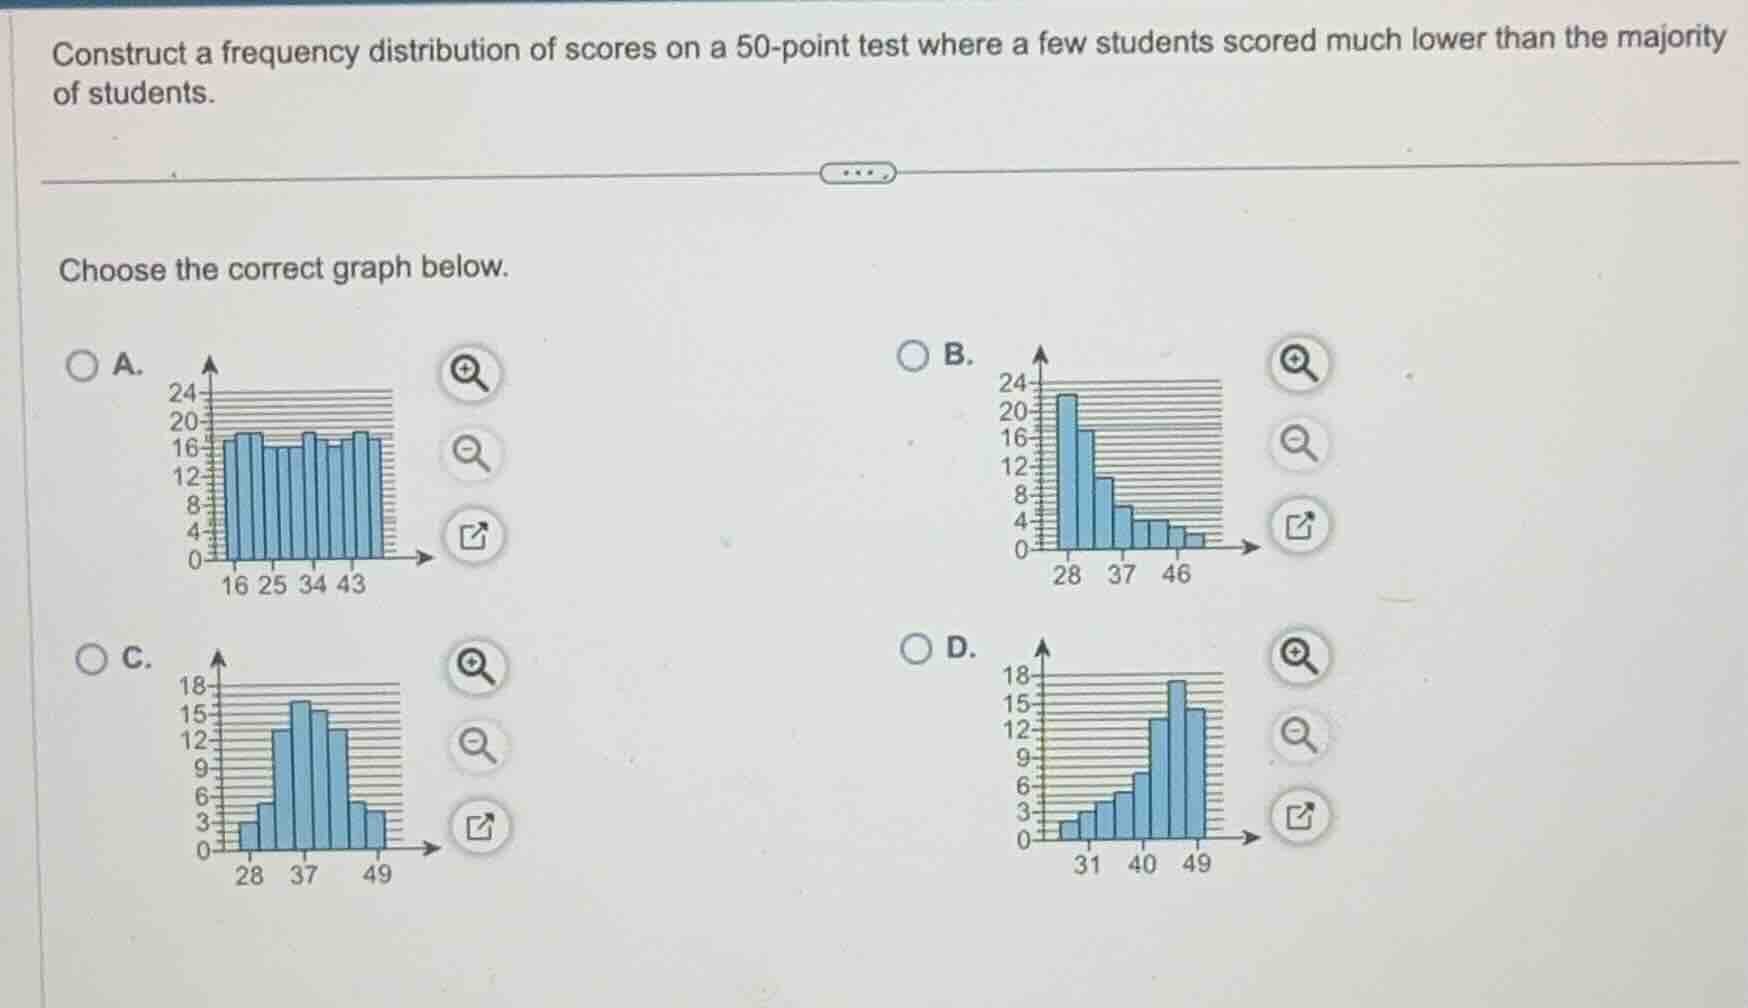
The problem describes a distribution of scores on a 50-point test where "a few students scored much lower than the majority of students." This means the majority of the scores are concentrated at the higher end of the scale (near 50), while a small number of low scores extend toward the left (lower values).
Identify the corresponding distribution shape
A distribution with a long tail extending to the left (lower values) is left-skewed (negatively skewed). The peak of the histogram should be on the right side, with the bar heights gradually decreasing as we move to the left.
Evaluate the given options
- A: Shows a uniform distribution where all classes have approximately equal frequencies.
- B: Shows a right-skewed distribution where the peak is on the left and the tail extends to the right (higher values).
- C: Shows a symmetric, bell-shaped distribution centered around 37.
- D: Shows a left-skewed distribution where the peak is on the right (near 46-49) and the tail extends to the left (lower values, down to 28-31), representing a few students scoring much lower than the majority.

Snap & solve any problem in the app
Get step-by-step solutions on Sovi AI
Photo-based solutions with guided steps
Explore more problems and detailed explanations
- (A) uniform distribution
- (B) right-skewed distribution
- (C) symmetric distribution
- (D) left-skewed distribution with a tail on the left (Correct answer)