QUESTION IMAGE
Question
consider the graph of the function below.
a. identify the independent and dependent variables, and describe the domain and range.
b. describe the function in words.
Identify variables
Using the Independent and Dependent Variables knowledge point
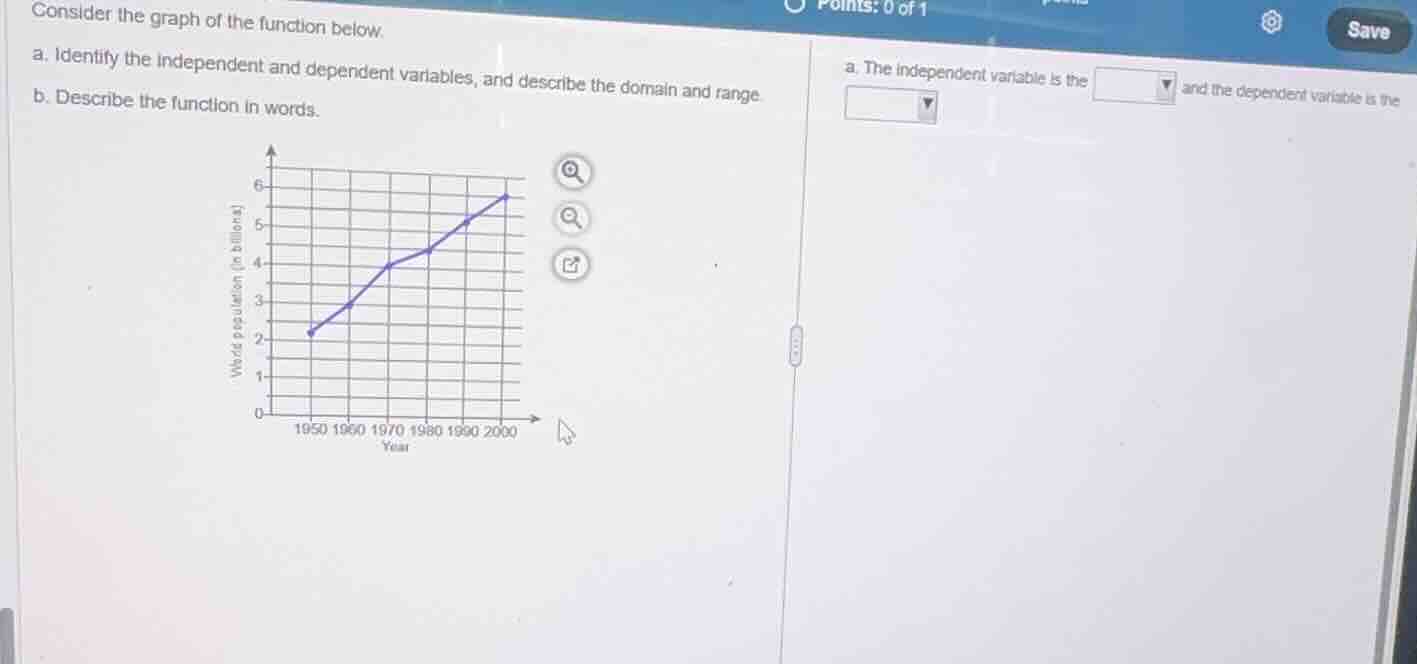
- The horizontal axis represents the independent variable: Year.
- The vertical axis represents the dependent variable: World population (in billions).
Determine domain and range
Using the Domain and Range knowledge point
- The graph starts at the year 1950 and ends at the year 2000. Thus, the domain is the set of years from 1950 to 2000: \([1950, 2000]\).
- The corresponding world population values start at approximately 2.2 billion in 1950 and reach approximately 6.0 billion in 2000. Thus, the range is approximately \([2.2\text{ billion}, 6.0\text{ billion}]\).
Describe function in words
Using the Function Representation knowledge point
- The function shows how the world population (in billions) changed over time from the year 1950 to 2000.
- The population increased steadily over this 50-year period.

Snap & solve any problem in the app
Get step-by-step solutions on Sovi AI
Photo-based solutions with guided steps
Explore more problems and detailed explanations
Question a
The independent variable is the year and the dependent variable is the world population (in billions).
The domain is the set of years from 1950 to 2000, which can be written as \([1950, 2000]\).
The range is the world population from approximately 2.2 billion to 6.0 billion, which can be written as \([2.2, 6.0]\) billion.
Question b
The function describes the steady increase of the world population (in billions) over time from the year 1950 to the year 2000.