QUESTION IMAGE
Question
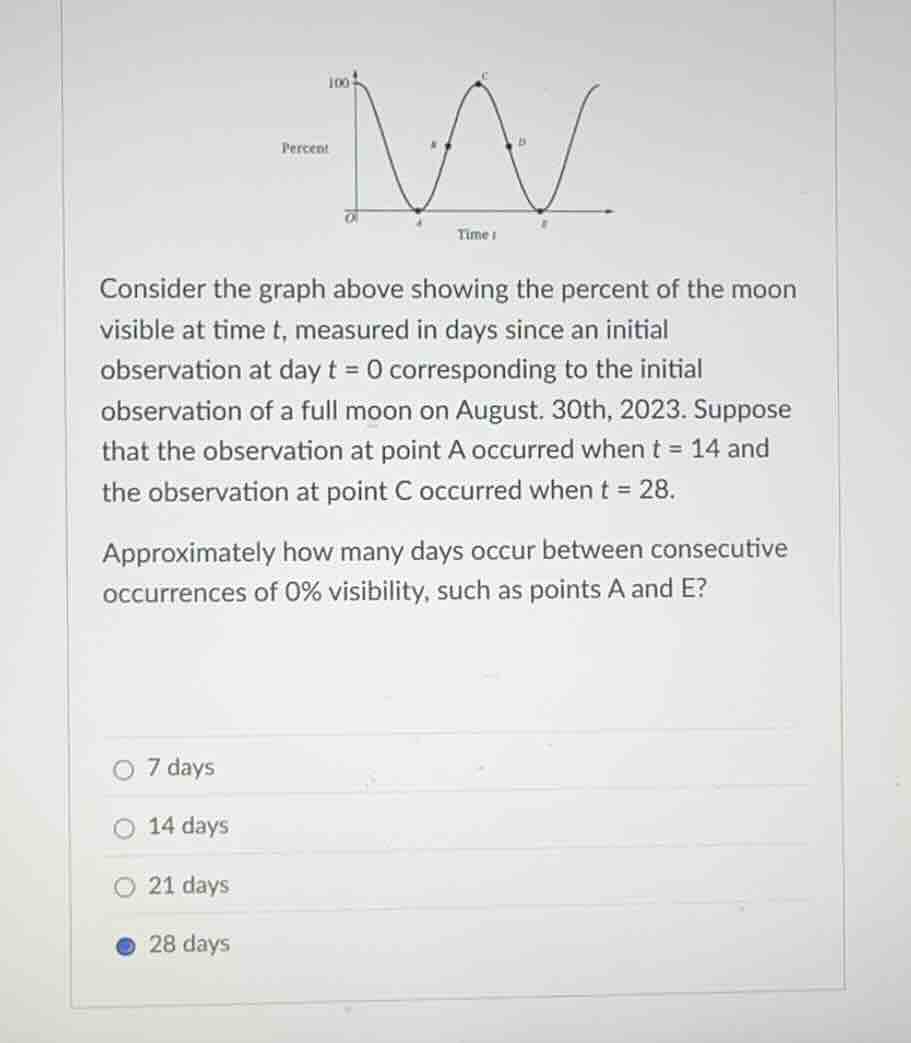
consider the graph above showing the percent of the moon visible at time \\(t\\), measured in days since an initial observation at day \\(t = 0\\) corresponding to the initial observation of a full moon on august 30th, 2023. suppose that the observation at point a occurred when \\(t = 14\\) and the observation at point c occurred when \\(t = 28\\).
approximately how many days occur between consecutive occurrences of 0% visibility, such as points a and e?
7 days
14 days
21 days
28 days
Identify the key points on the graph
Using the Periodic Functions and Mathematical Modeling knowledge points:
- At \(t = 0\), the visibility is at a maximum of \(100\%\) (full moon).
- Point A is the first minimum where visibility is \(0\%\) (new moon), occurring at \(t = 14\).
- Point C is the next maximum where visibility is \(100\%\), occurring at \(t = 28\).
- Point E is the second minimum where visibility is \(0\%\).
Determine the period of the function
Using the Periodic Functions knowledge point:
- The time from a maximum (\(t = 0\)) to the next consecutive maximum (Point C, \(t = 28\)) represents one full cycle (period, \(T\)).
- Therefore, the period is:
Calculate the time between consecutive minima
Using the Periodic Functions knowledge point:
- Consecutive occurrences of \(0\%\) visibility (such as points A and E) are consecutive minima of the periodic function.
- The time interval between any two consecutive minima is equal to one full period \(T\).
- Since \(T = 28\text{ days}\), the time between point A and point E is:

Snap & solve any problem in the app
Get step-by-step solutions on Sovi AI
Photo-based solutions with guided steps
Explore more problems and detailed explanations
- 7 days
- 14 days
- 21 days
- 28 days (Correct answer)