QUESTION IMAGE
Question
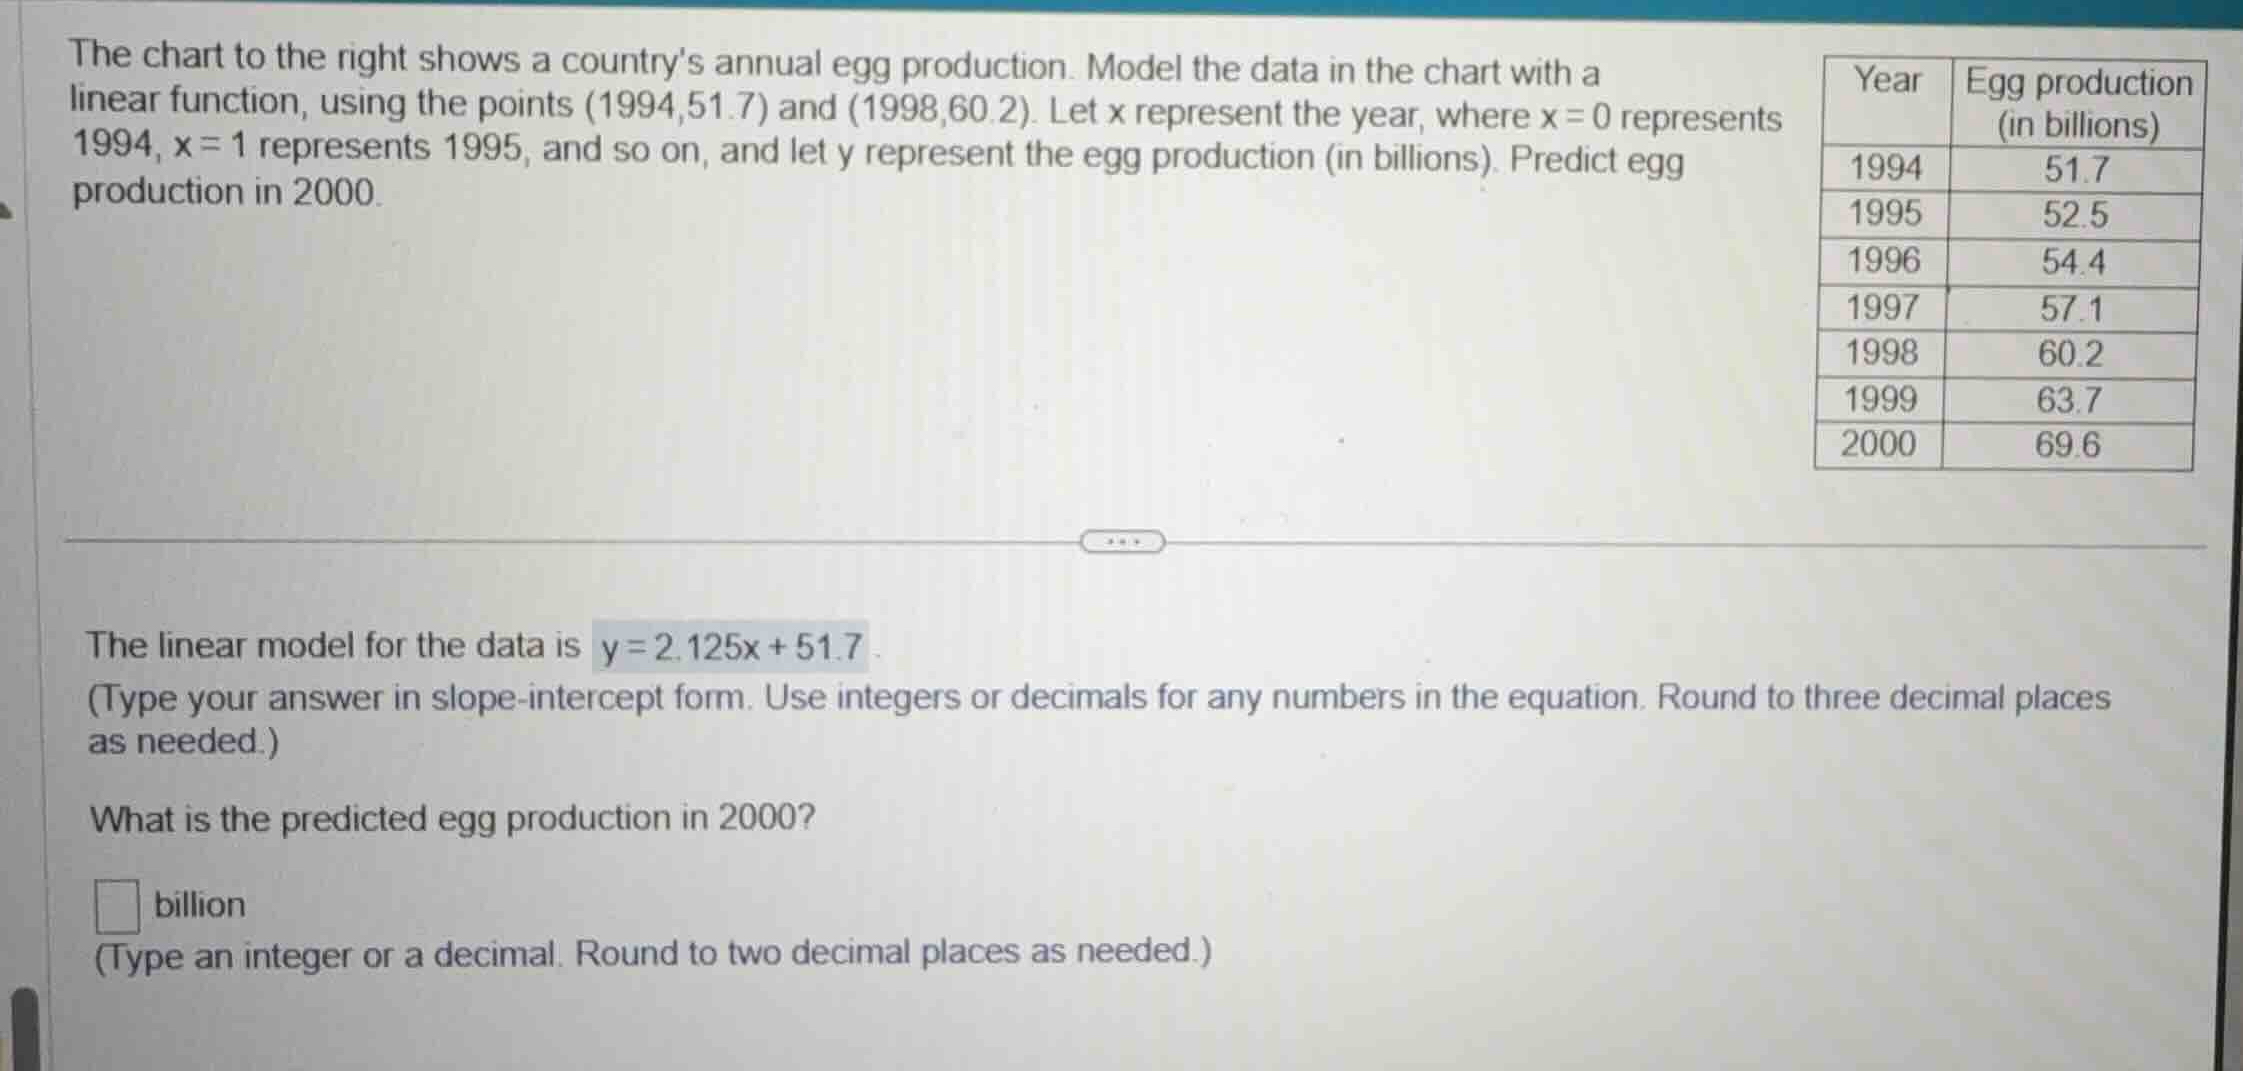
the chart to the right shows a countrys annual egg production. model the data in the chart with a linear function, using the points (1994,51.7) and (1998,60.2). let x represent the year, where x = 0 represents 1994, x = 1 represents 1995, and so on, and let y represent the egg production (in billions). predict egg production in 2000.
the linear model for the data is \\(y = 2.125x + 51.7\\).
(type your answer in slope-intercept form. use integers or decimals for any numbers in the equation. round to three decimal places as needed.)
what is the predicted egg production in 2000?
billion
(type an integer or a decimal. round to two decimal places as needed.)
Identify the given linear model
Using the Linear Models and Slope-Intercept Form knowledge points
Determine the value of x for the year 2000
Using the Linear Equations knowledge point
Calculate the predicted egg production
Using the Linear Equations knowledge point

Snap & solve any problem in the app
Get step-by-step solutions on Sovi AI
Photo-based solutions with guided steps
Explore more problems and detailed explanations
What is the predicted egg production in 2000?
<blank>64.45</blank> billion