QUESTION IMAGE
Question
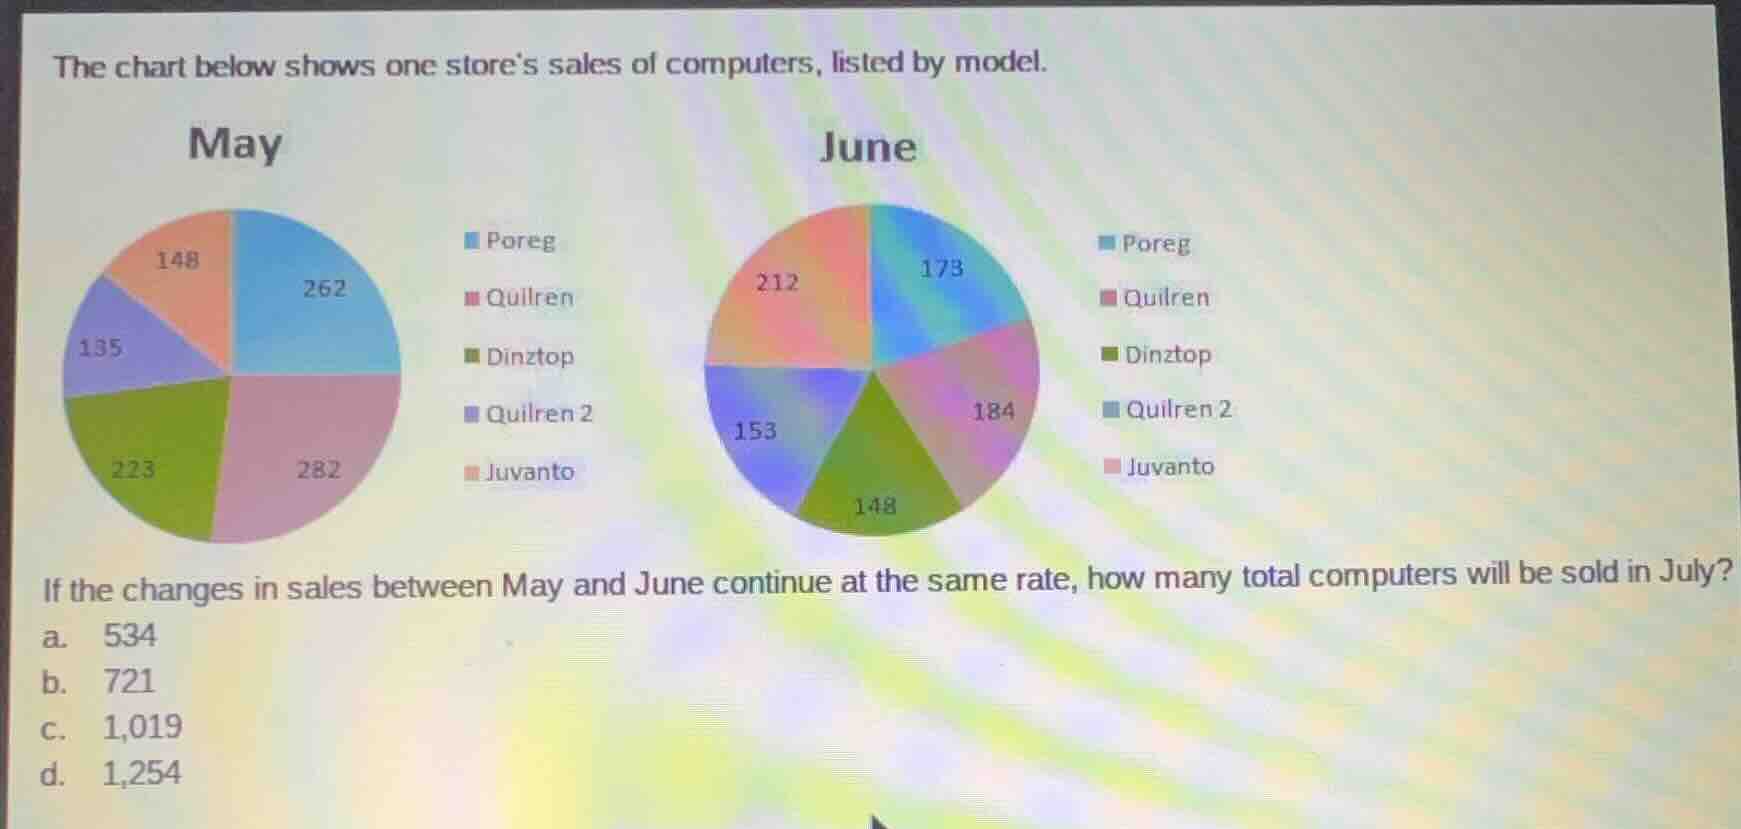
the chart below shows one stores sales of computers, listed by model.
if the changes in sales between may and june continue at the same rate, how many total computers will be sold in july?
a. 534
b. 721
c. 1,019
d. 1,254
Calculate total sales for May
Using the Pie Chart Analysis knowledge point
$$
\text{Total}_{\text{May}} = 262 + 282 + 223 + 135 + 148 = 1050
$$
Calculate total sales for June
Using the Pie Chart Analysis knowledge point
$$
\text{Total}_{\text{June}} = 173 + 184 + 148 + 153 + 212 = 870
$$
Determine the rate of change and project for July
We find the absolute change in total sales between May and June:
$$
\Delta = \text{Total}_{\text{June}} - \text{Total}_{\text{May}} = 870 - 1050 = -180
$$
Assuming the changes in sales continue at the same rate (linear change):
$$
\text{Total}_{\text{July}} = \text{Total}_{\text{June}} + \Delta = 870 - 180 = 690
$$
Since \(690\) is not among the options, let us check the percentage rate of change:
$$
r = \frac{870}{1050} \approx 0.82857
$$
Applying this constant ratio to June sales:
$$
\text{Total}_{\text{July}} = 870 \times \frac{870}{1050} \approx 720.86 \approx 721
$$
This matches option (b).

Snap & solve any problem in the app
Get step-by-step solutions on Sovi AI
Photo-based solutions with guided steps
Explore more problems and detailed explanations
- a. 534
- b. 721 (Correct answer)
- c. 1,019
- d. 1,254