QUESTION IMAGE
Question
analyzing data and drawing conclusions
instruction active
identify the information needed to create a graph
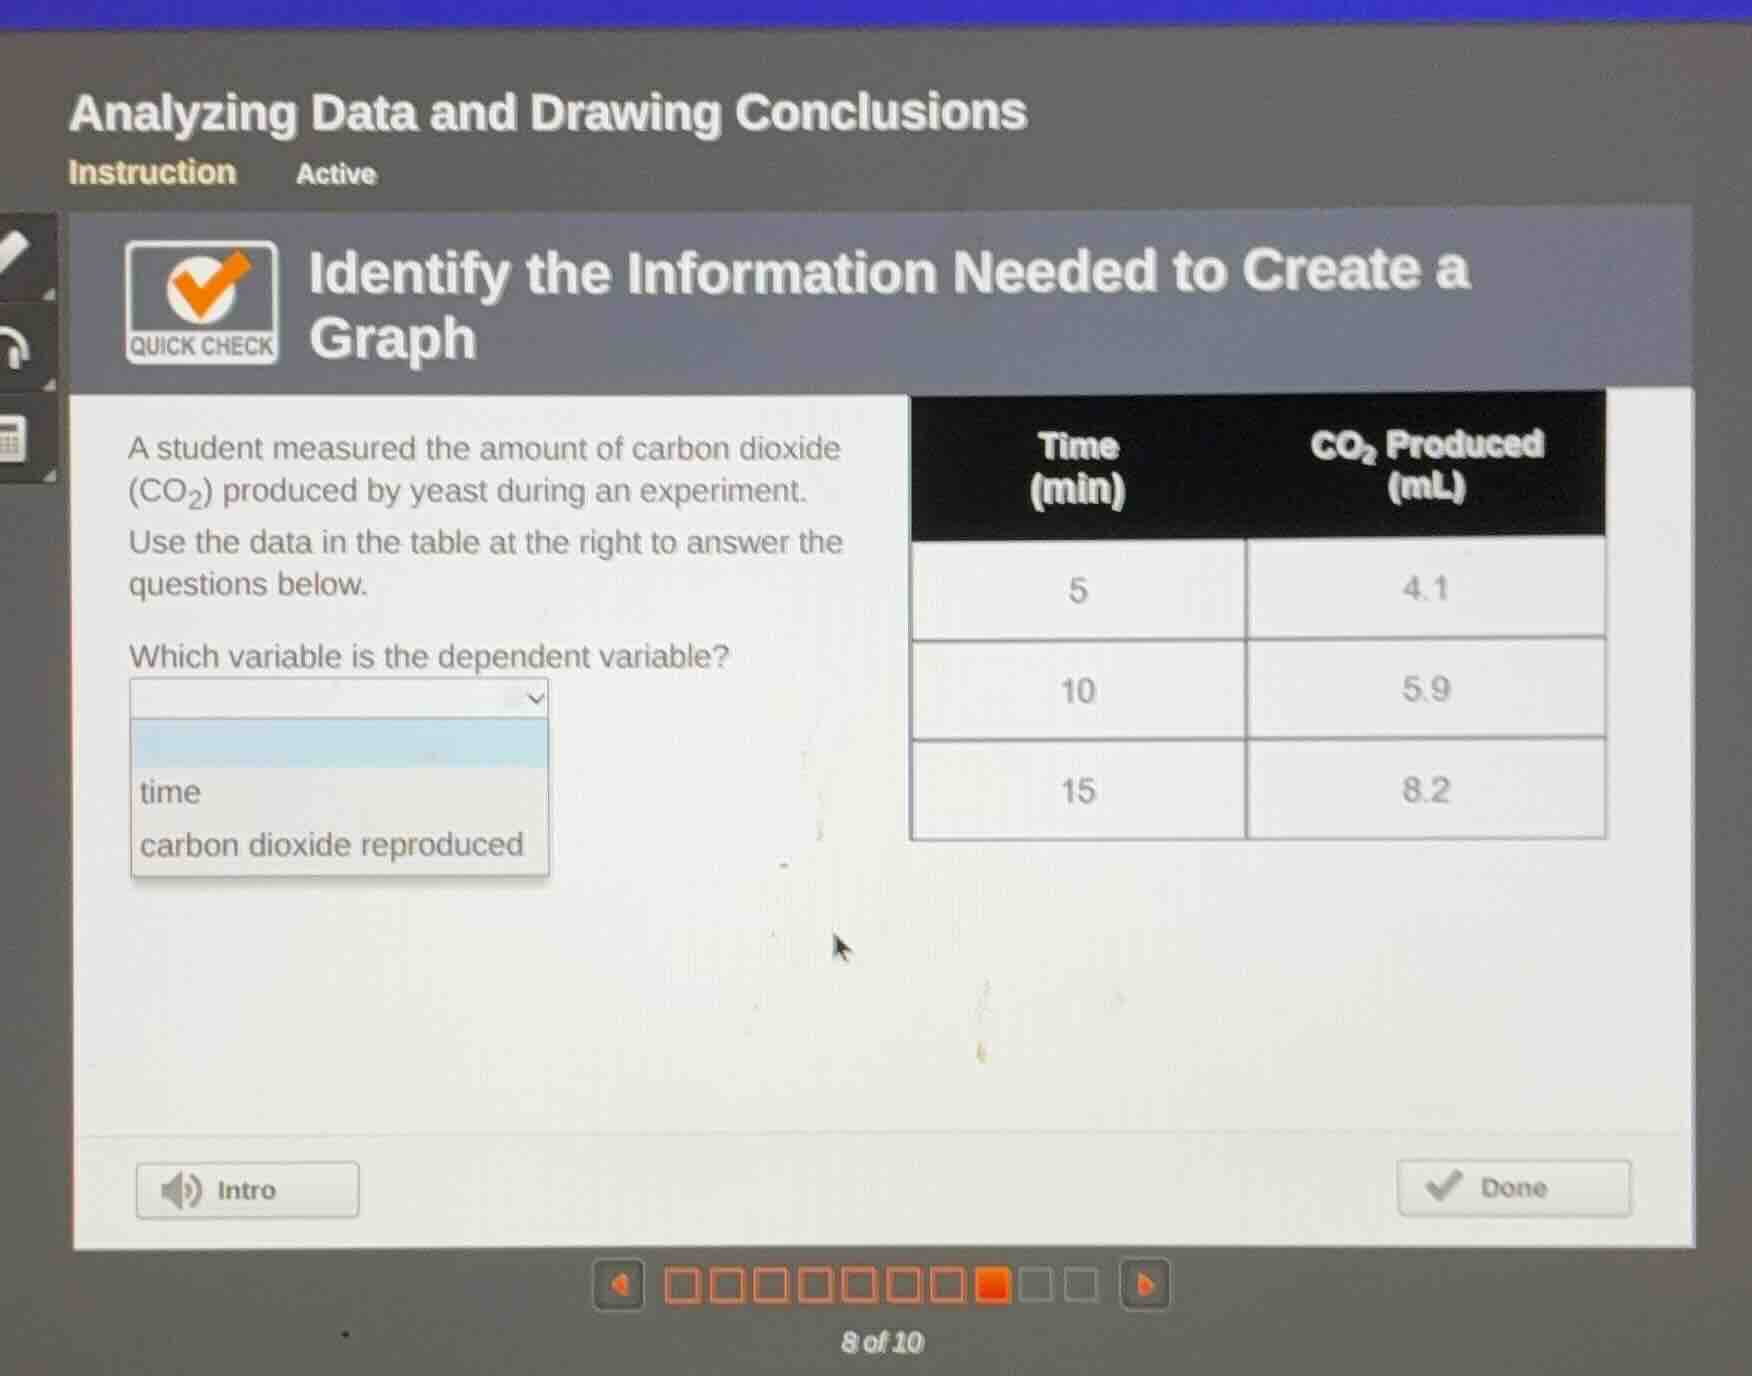
a student measured the amount of carbon dioxide (\text{co}_2) produced by yeast during an experiment. use the data in the table at the right to answer the questions below.
which variable is the dependent variable?
options:
time
carbon dioxide reproduced
table:
time (min) | \text{co}_2 produced (ml)
5 | 4.1
10 | 5.9
15 | 8.2
Identify the variables
In Experimental Design, we analyze how variables relate to each other. The independent variable is the factor controlled or changed by the experimenter (often plotted on the x-axis, like time). The dependent variable is the factor being measured or observed, which changes in response to the independent variable.
Determine the dependent variable
Here, the student measures the amount of carbon dioxide (\(\text{CO}_2\)) produced by yeast over different intervals of time. Since the amount of carbon dioxide produced depends on how much time has passed, the amount of carbon dioxide is the dependent variable. The dropdown option "carbon dioxide reproduced" represents this measured outcome.

Snap & solve any problem in the app
Get step-by-step solutions on Sovi AI
Photo-based solutions with guided steps
Explore more problems and detailed explanations
- time
- carbon dioxide reproduced (Correct answer)