QUESTION IMAGE
Question
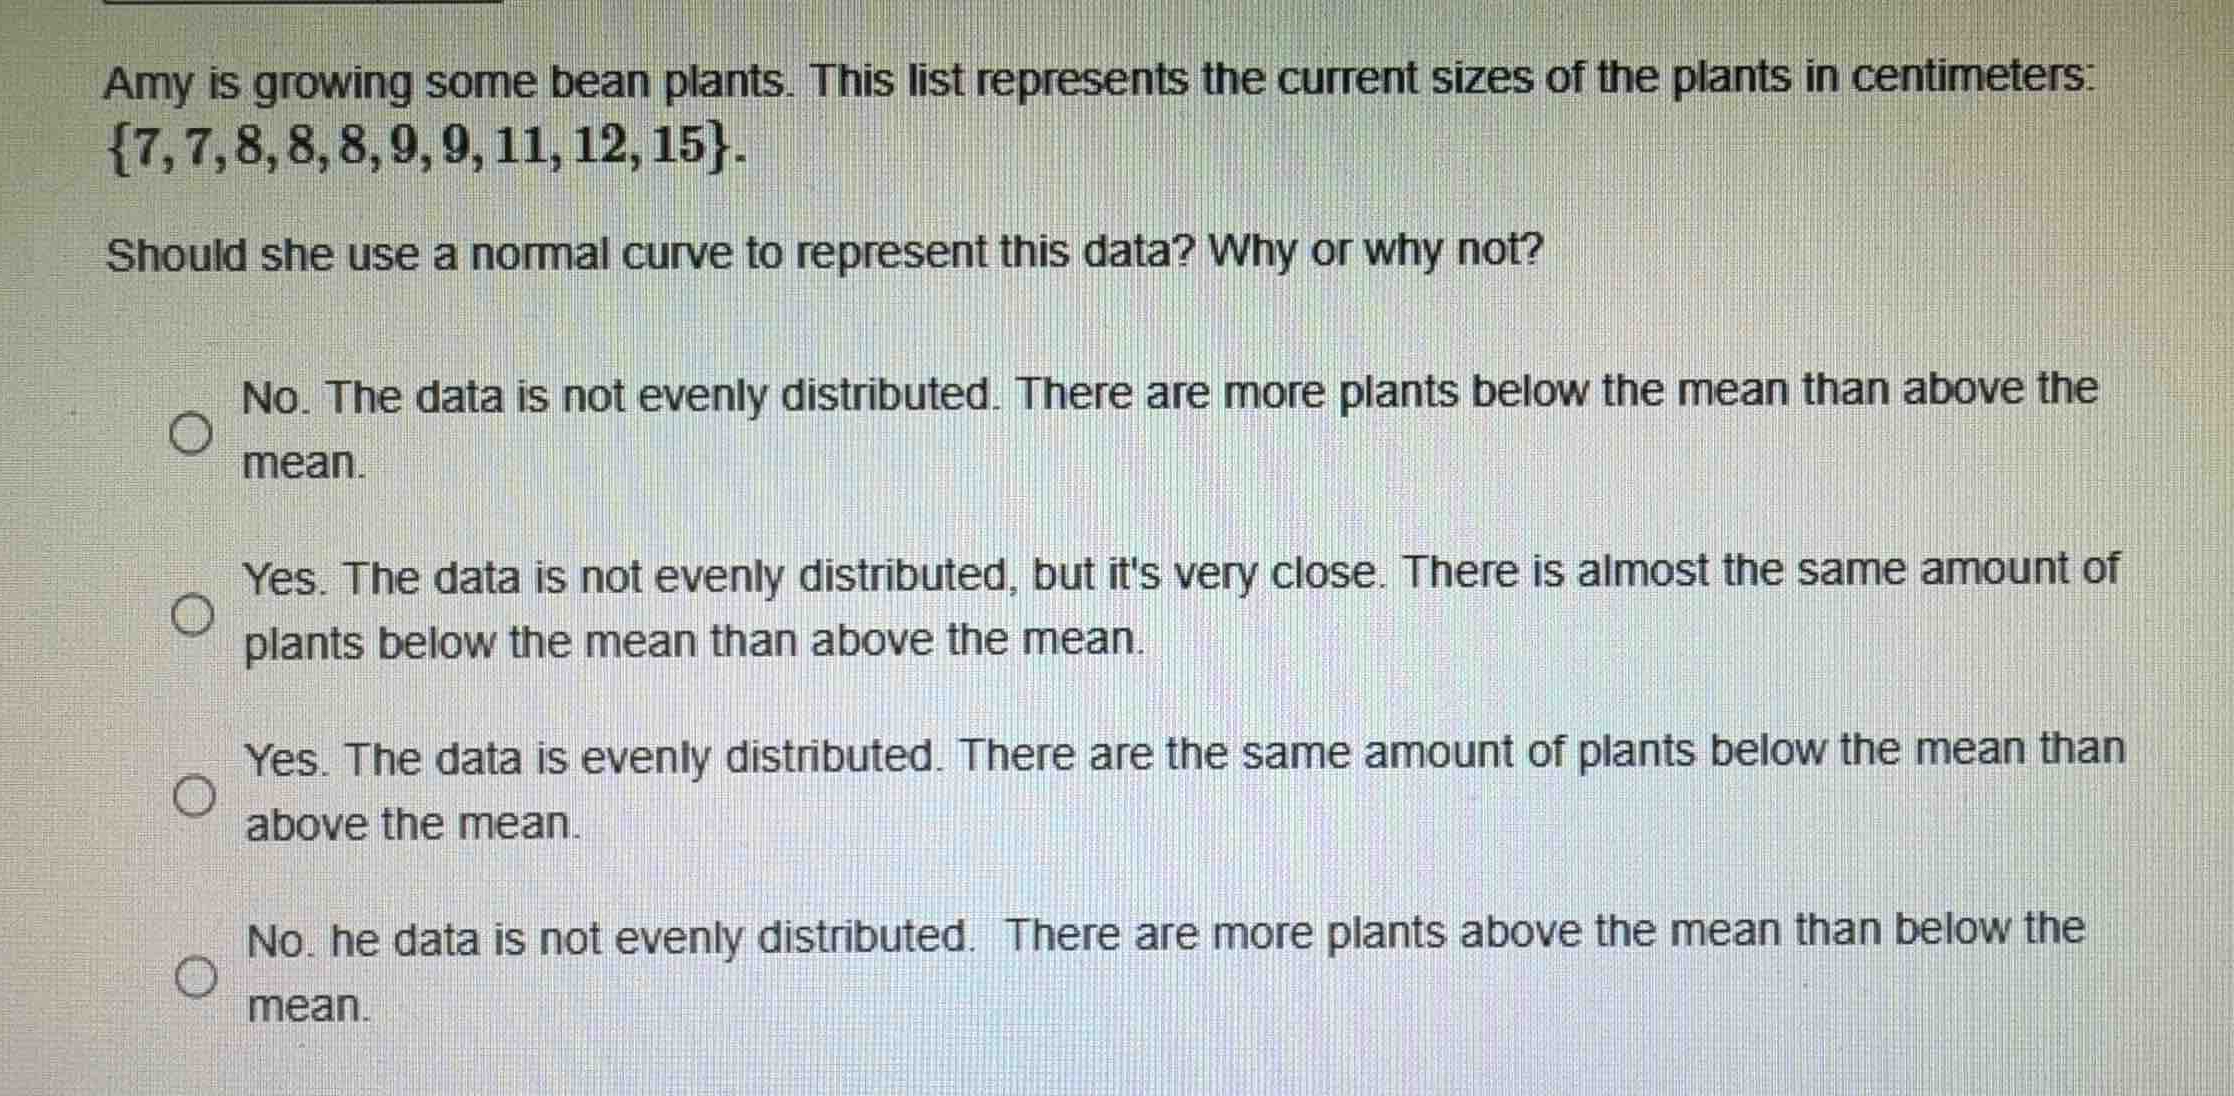
amy is growing some bean plants. this list represents the current sizes of the plants in centimeters:
\\{7, 7, 8, 8, 8, 9, 9, 11, 12, 15\\}.
should she use a normal curve to represent this data? why or why not?
- no. the data is not evenly distributed. there are more plants below the mean than above the mean.
- yes. the data is not evenly distributed, but its very close. there is almost the same amount of plants below the mean than above the mean.
- yes. the data is evenly distributed. there are the same amount of plants below the mean than above the mean.
- no. he data is not evenly distributed. there are more plants above the mean than below the mean.
Calculate the sample mean
Using the Sample Mean knowledge point, we sum the data values and divide by the total number of observations \(n = 10\):
Analyze data distribution relative to the mean
Using the Symmetry Analysis knowledge point, we compare each data point to the calculated mean of \(9.4\):
- Values below the mean (\(< 9.4\)): \(\{7, 7, 8, 8, 8, 9, 9\}\) (7 plants)
- Values above the mean (\(> 9.4\)): \(\{11, 12, 15\}\) (3 plants)
Determine suitability for a normal curve
Using the Normal Distribution Suitability knowledge point, a normal distribution must be symmetric, meaning approximately equal amounts of data should lie on either side of the mean. Here, 7 plants are below the mean and only 3 are above. Thus, the data is not evenly distributed, and there are more plants below the mean than above it.

Snap & solve any problem in the app
Get step-by-step solutions on Sovi AI
Photo-based solutions with guided steps
Explore more problems and detailed explanations
- (A) No. The data is not evenly distributed. There are more plants below the mean than above the mean. (Correct answer)
- (B) Yes. The data is not evenly distributed, but it's very close. There is almost the same amount of plants below the mean than above the mean.
- (C) Yes. The data is evenly distributed. There are the same amount of plants below the mean than above the mean.
- (D) No. he data is not evenly distributed. There are more plants above the mean than below the mean.