QUESTION IMAGE
Question
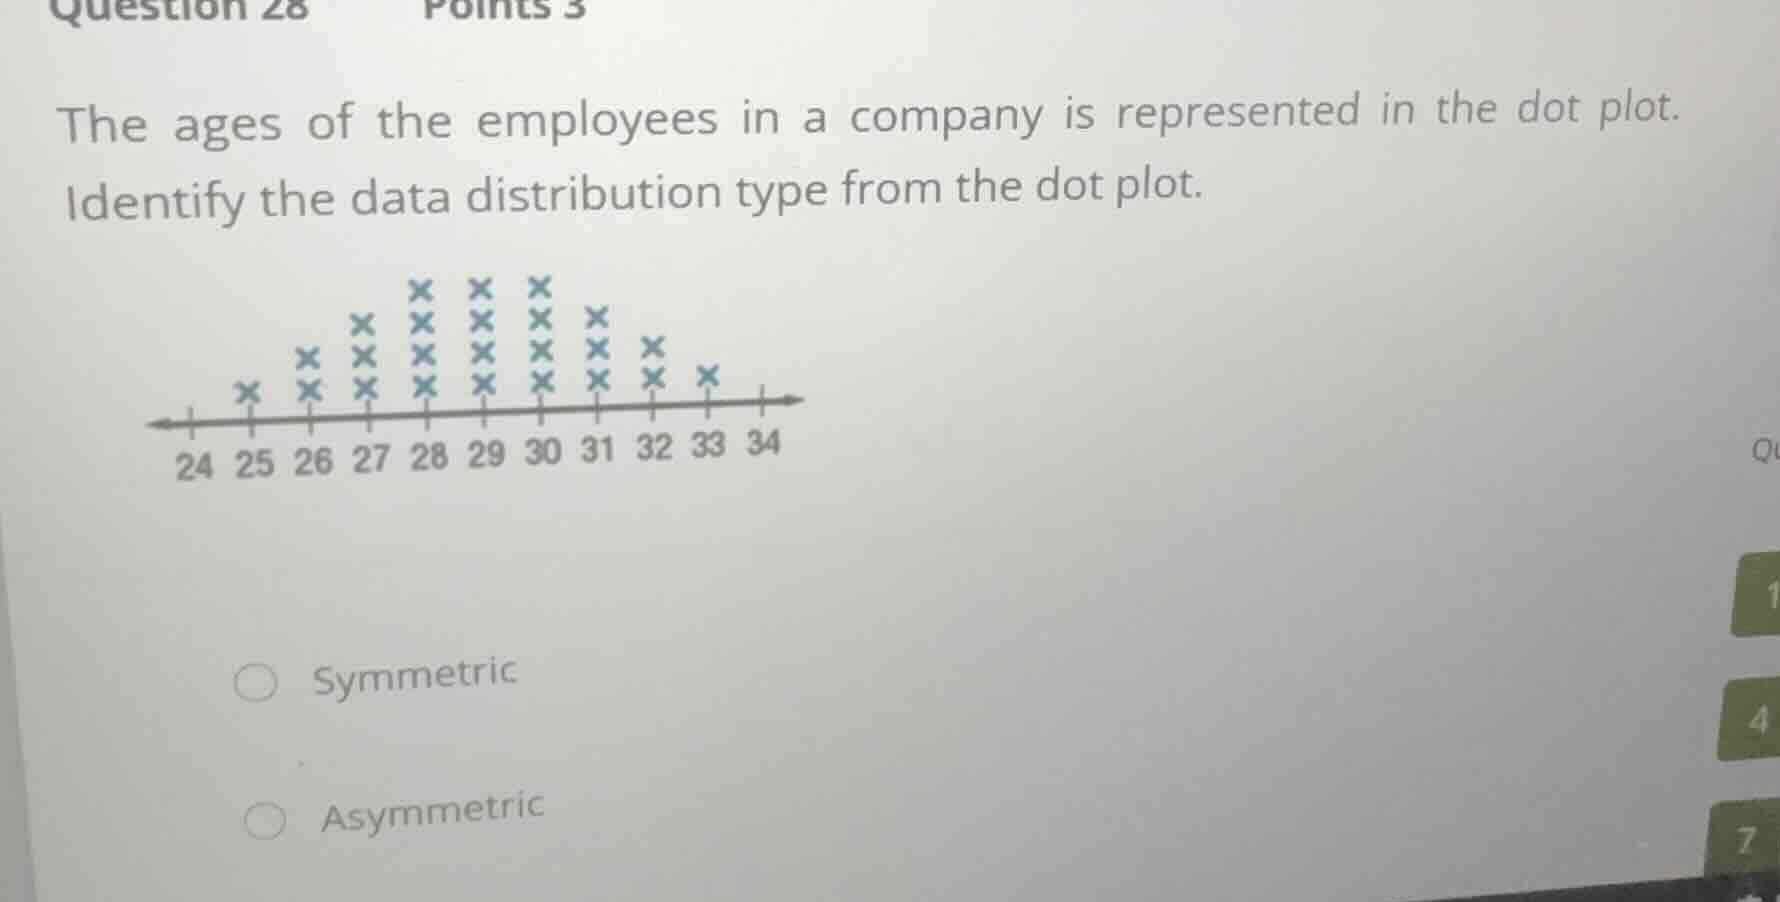
the ages of the employees in a company is represented in the dot plot. identify the data distribution type from the dot plot.
symmetric
asymmetric
Analyze the dot plot structure
Using the Symmetric Distribution knowledge point
The dot plot displays the ages of employees on a horizontal axis ranging from 24 to 34. Let's count the number of data points (represented by 'x') at each age:
- 25: 1
- 26: 2
- 27: 3
- 28: 4
- 29: 4
- 30: 4
- 31: 3
- 32: 2
- 33: 1
Determine the distribution shape
Using the Symmetric Distribution knowledge point
The center of the distribution lies between 29 and 30. If we look at the frequencies on either side of this center:
- Left side (28, 27, 26, 25) has frequencies: 4, 3, 2, 1.
- Right side (30, 31, 32, 33) has frequencies: 4, 3, 2, 1.
Because the left and right halves of the dot plot form mirror images of each other, the shape of the data distribution is symmetric.

Snap & solve any problem in the app
Get step-by-step solutions on Sovi AI
Photo-based solutions with guided steps
Explore more problems and detailed explanations
- Symmetric (Correct answer)
- Asymmetric